Secondary Chilled Water Pump Measurement Guide
Published: June 24, 2020
By: Phillip Chao, PhD | Applied Research Scientist, Peter Phung, Tom Lui | Interns, Duncan Prahl, RA, AIA | Sr. Applied Research Scientist
Reviewed by: Jillian Panagakos | Jr. Engineer, Honey Berk, LEED AP O&M,CMVP | Managing Director
Helpful Resources
Download this Guide
DownloadGeneral System Overview
This guide describes the measurement approach for quantifying avoided energy use associated with retrofitting pumps in the secondary loop of a chilled water pump system with VFDs and/or more efficient motors.
Safety
This guide does not cover health and safety aspects of the collection of measurements at facilities. There are many hazards that exist in facilities surrounding the collection of measurements, including but not limited to: electrical safety, fall protection, personal protective equipment, control of hazardous energy (lock out/ tag out), confined space, respiratory protection, and machine safeguarding. Part of the measurement planning process must include the identification and mitigation of these and other hazards. The implementation of a measurement strategy and installation of measurement equipment should be performed by qualified personnel.
Description of System
The following sections provide background information on the components of a primary-secondary chilled-water pump system. If you are already familiar with the system, you may skip to the Measurement Description for System section.
System Overview
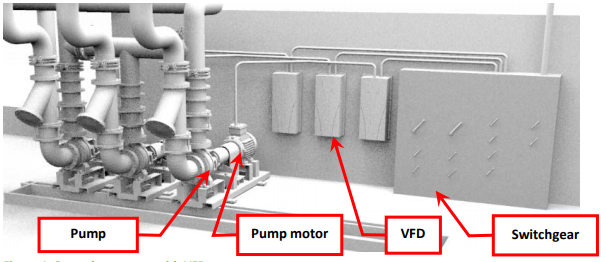
In a primary-secondary chilled-water pump system, primary pumps circulate water returning from the building through the chiller and the secondary pumps circulate chilled water from the chiller to the cooling coils throughout the building. Centrifugal pumps are the most common type of pumps used.
The components of the system depend on the system configuration. There are two common configurations: 1) constant speed pumps with relatively constant pressure; and 2) pumps with variable frequency drives (VFDs) that maintain a constant pressure. An image of secondary pumps with VFDs is shown in Figure 1.
Constant Speed, Constant Pressure
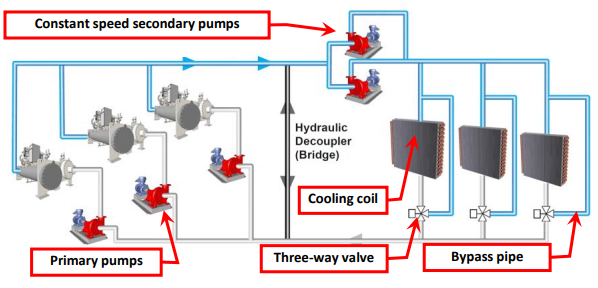
In this configuration, the secondary pump speed is constant regardless of cooling load. As shown in Figure 2, each coil has a three-way valve and a bypass pipe. Chilled water is sent through the coil based on the cooling load and the excess flow is distributed through the bypass pipe. The pressure drop across each coil and bypass pipe remains relatively constant in the secondary loop. This system is the typical pre-retrofit condition for older systems.
Variable Speed, Variable Flow, Constant Differential Pressure
In this configuration, pump speed and flow are controlled by maintaining constant differential pressure in the secondary loop. This is measured at the point where the maximum pressure drop exists in the system (usually after the coil farthest from the secondary pumps) where a three-way valve and bypass pipe is installed. As shown in Figure 3, the remaining coils have two-way valves that modulate chilled water flow based on the cooling load and bypass piping has been removed or disabled. The three-way valve at the farthest coil keeps the bypass open when all coils are off. The speed of the secondary pumps is varied to maintain a constant pressure throughout the secondary loop regardless of the total flow needed, which is based on the valve position of all coils. This system is the typical post-retrofit condition.
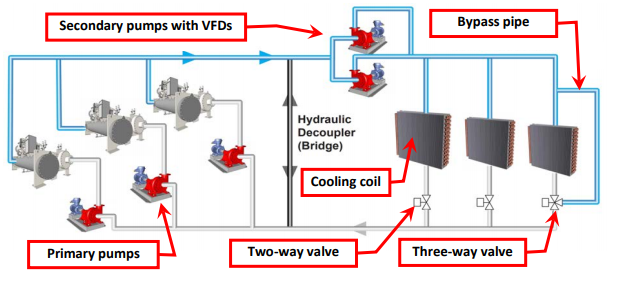
There are two general arrangements of the pumps within the secondary loop: 1) a headered set of pumps at the start of a loop, as shown in Figure 2 and Figure 3; or 2) individual pumps that operate for different zones or subloops in the facility. For headered pumps, two sizes of secondary pumps may be also be installed: 1) a smaller pump for spring and fall operation when the cooling loads are lower; or 2) a larger pump for operation during the hotter summer months.
Key Variables Associated with Calculating Energy Consumption
The primary energy source for a secondary chilled water pump system is electricity, which is measured in kWh. The electricity consumption of a water pump motor is a function of the pump’s operating hours and the speed, where the pump affinity laws define power as proportional to the cube of speed. The relevant variables used to characterize the electricity consumption of secondary chilled water pumps are:
- True RMS power input to the VFD or motor for all pumps in the secondary chiller loop
- Operating schedule
- OAT (if pumps speed is temperature-dependent)
There are two operating modes described in this guide. The first is for constant speed systems where no VFD has been installed. True RMS power draw (kW) is multiplied by operating time (hours) to compute electricity consumption (kWh). The model assumes that the power draw is relatively constant at any operating condition and combination of three-way valve positions. The primary measurements, taken over several weeks, confirm the power draw and operating schedule.
The second mode is for secondary pumps equipped with a VFD. The secondary pump speed is varied based on the overall differential pressure in the secondary loop, which is a function of the number of coils that are calling for chilled water, which is assumed to vary with OAT. A regression model can be created for the hourly average true RMS power as a function of hourly average OAT. The annual electrical consumption is then the true RMS power (kW) drawn by the pump motor at a given OAT for each hour multiplied by the hours of operation of the pump at that given OAT.
Operating Characteristics
The secondary chilled water pumps are one component in the larger chiller plant system. An overall operational strategy is needed for the chiller plant that varies by the overall components in the chiller system, the type of building and occupancy, and the building operations staff. It is important to interview the operations staff to understand how the secondary pumps are operated, and to develop a measurement strategy that will appropriately capture all modes of operation. Chiller operation typically takes place during the cooling season, generally from April to October. Chillers are most commonly either turned off or have temperature setbacks overnight, unless the building has a 24-hour occupancy (e.g., hospital). Regardless of setbacks or scheduled operation, a minimum flow needs to be maintained through the chillers when they are operating.
Pressure and flow are controlled by a combination of the pump characteristics and the operation of the cooling coil valves. Generally, the pump is selected for a peak flow rate (gpm) with all coils open. In a fixed speed pumping system, the three-way cooling coil valves and bypass piping are designed to allow the peak flow rate through the secondary loop regardless of the valve position. A key to successful VFD implementation is to disable most of the bypass piping so that the total flow rate in the secondary loop is driven by the flow through the cooling coils based on cooling demand. Furthermore, the three-way valves should be replaced as needed to ensure efficient operation of the system post-retrofit. This flow rate varies by control of the pump speed to maintain a constant differential pressure in the secondary loop.
Scope of This Guide
The profile of energy consumption and avoided energy use associated with two types of ECMs can be characterized using this guide:
- High Efficiency Motor replacement – Replacing an existing motor with a premium efficiency motor can yield avoided energy use by increasing the useful work output per unit of electricity consumed. It is important to make sure the RPM of the pump is the same after the retrofit. High-efficiency motors sometimes run at a slightly higher shaft RPM per HP, and the increased RPM can negate any savings from the improved efficiency. The pump impeller may need to be replaced as part of the motor replacement to maintain pump RPM.
- VFD installation – Because VFDs control the relative speed of the pump, significant avoided energy use can result from implementing variable speed controls on constant volume systems, depending on the type of motor and pump involved. VFDs must be compatible with the motor that is to be upgraded.
This document is designed to assist in gathering both pre- and post-retrofit data for the electricity consumption of secondary chilled water loop pumps. As such, a primary goal is to describe the measurements and the appropriate equipment to perform those measurements. Guidance is provided for measuring both constant and variable speed motors for the secondary pumps in each of the configurations detailed above.
The guidance provided assumes the chiller is either air-cooled or water-cooled, however secondary pumping systems are most common on larger water-cooled chillers. It also assumes that the operation of the chiller and cooling tower are not substantially modified as part of this retrofit. If a change in the facility’s hours of operation is detected between the pre- and post-retrofit measurements, further investigation should be undertaken to determine if a routine or non-routine event took place and needs to be accounted for in the savings calculations. Routine events include holidays or vacation weeks that may occur during the measurement period; non-routine events include unscheduled shutdowns or emergency 24-hour operations.
The primary chilled-water pumping system is not covered in this guide, although the measurement techniques for a primary pumping system would be similar. Interactive effects with whole-facility heating and cooling loads due to the upgrade of the pump motors are similarly not addressed.
Measurements
Measurement Approach
This guide is focused on characterizing the avoided electricity use associated with changes to the pump motor efficiency, speed, and operating schedule. As such, the measurement boundary of the system, per this guide, is defined as the secondary pump motors plus their associated VFDs, if installed. Figures 4 and 5 illustrate the measurement boundary defined for the measurement approaches presented in this guide.
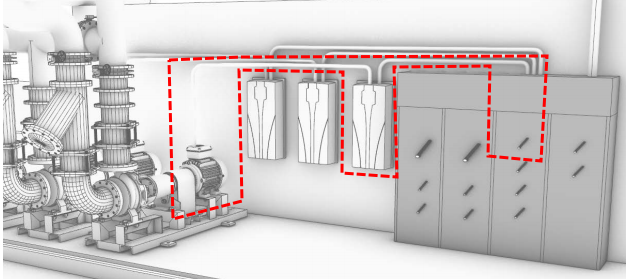
The measurement strategy for this system is determined by the true RMS power of the 3-phase power supply either at the power main for the motor (outlined in red in Figure 4) or at the three-phase input to the VFD (outlined in red Figure 5).
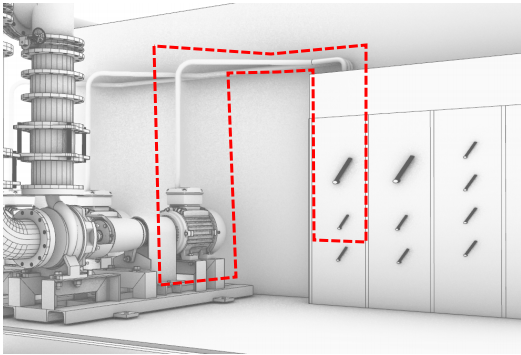
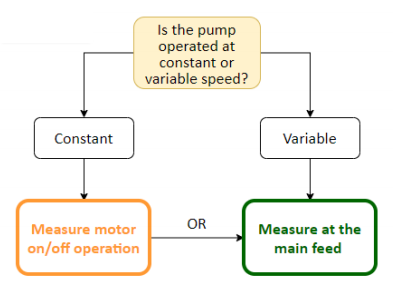
The appropriate measurement strategy is determined by whether the pump is operated at constant or variable speed. Figure 6 depicts a decision tree that can be used to determine which measurement strategy to apply to a specific system, based on its configuration and components.
Sampling
The measurement plan should include all pump motors in the secondary chiller circuit. As discussed earlier, different size pumps may be operated at different times of the year, in which case both pump motors should be measured. In most cases there is also a standby pump that is used as part of regular operations, to keep uniform wear on all pumps in the system. If a standby pump is used, or if pumps are regularly cycled, those pump motors should also be measured. If a more rigorous sampling plan is needed, Bonneville Power Administration has developed an excellent reference for guidance[1].
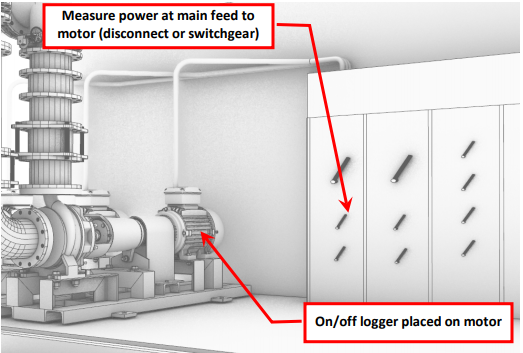
Measure Motor On/Off Operation
This strategy, represented in Figure 7, is for the pre-retrofit condition for a constant speed system and for the post-retrofit condition when replacing a constant speed system with a higher efficiency motor. The approach assumes that the power draw stays constant throughout the measurement period. Because the motor runs at constant speed, it is either operating at full power (when on) or it is drawing no power (when off). As such, a motor on/off data logger is used to record the operating schedule.
The following parameters should be measured:
- True RMS power of the motor that drives the pump (kW)
- Pump motor runtime
If it is not possible to determine whether the pump motor has a constant power draw (e.g., through physical observation of the system, an interview with the building operator, or review of as-built drawings), it is best to use the alternative measurement approach described below.
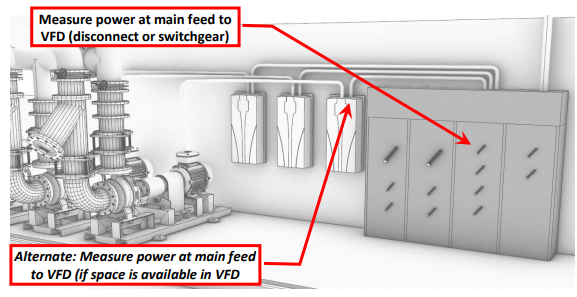
Measure Directly on the Main Feed (Panel or Switchgear)
This strategy, represented in Figure 8, is used to directly measure the power consumed by a constant or variable speed system. When power draw varies, a direct or proxy measurement of power is needed to characterize how it is affected by operational schedule or OAT. Because pump power is proportional to the cube of the pump speed, it is important to measure the power draw over the full range of loading conditions. For variable speed pumps, at least four to six weeks during the hottest time of summer and a few weeks during spring or fall should be sufficient to capture the operation of the system with respect to OAT[2].
The following parameters should be measured:
- Continuous energy consumption of the motor that drives the pump (kWh)
- OAT (oF)
Measurement Tools and Equipment
The measurements in this guide can be performed with the equipment listed in Table 1; more detailed descriptions have been provided in Table 2. NYC agency employees can borrow recommended equipment from NYC Energy Tools, and have it delivered to their facility. Third-party M&V consultants and others can use this equipment list as guidance, recognizing that many manufacturers make comparable equipment. Inclusion on the list in Table 1 or Table 2 should not be construed as an endorsement of these manufacturers.
| Measurement | Units | Tool | Equipment |
|---|---|---|---|
| True RMS Power | kW | Clamp Meter | Fluke 345 Power Quality Clamp Meter |
| Apparent Current | Amperes | Current Sensor and Data Logger | Onset HOBO Split-Core Current Sensor Onset HOBO 4-Channel Analog Data Logger (UX120-006M) |
| True RMS Energy | kWh | Data-logging Power Meter and Current Transformers | DENT ELITEproXC Portable Power Data Logger (EXCUNC) Dent 16” RoCoil Flexible Rope Current Transformers (CT-R16-A4-U) |
| Motor Runtime | Seconds / Hour | Motor On/Off Logger | Onset HOBO Motor On/Off Data Logger (UX90-004) |
| OAT | °F | Weatherproof Temperature/Relative Humidity Data Logger | Onset HOBO Temperature/Relative Humidity Weatherproof Data Logger (MX2301) |
| Equipment | Description |
|---|---|
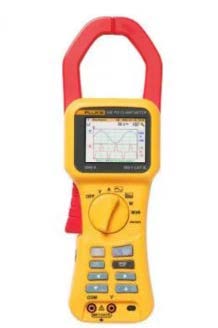 Fluke 345 Power Quality Clamp Meter | Multi-purpose electrical measurement tool used to take true RMS power readings over a short period of time. |
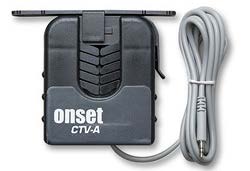 Onset HOBO Split-Core Current Sensor | Provides a measurement of the current flowing through a conductor and converts to a signal the U12- or UX120-series data logger can record. Rated for specific amperage ranges – CTV-A 2-20 amps, CTV-B 5-50 amp or CTV-C 10-100 amp). Sensor should be selected based on the maximum or minimum amperage anticipated to be measured, to avoid out of range readings. |
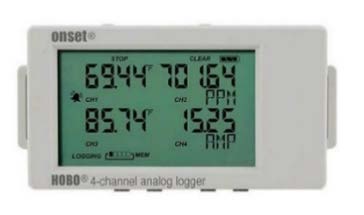 Onset HOBO 4-Channel Analog Data Logger (UX120-006M) | Used in conjunction with the CTV series of sensors. Records measurements from up to four CTV sensors. Requires HOBOware software and a USB connection cable for programming and downloading data files. |
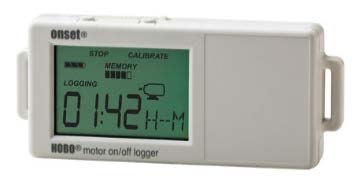 Onset HOBO Motor On/Off Data Logger (UX90-004) | Records when a motor is on and off, as well as runtime. Requires HOBOware software and a USB connection cable for programming and downloading data files. |
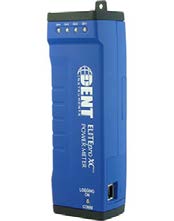 DENT ELITEproXC Portable Power Data Logger (EXCUNC) 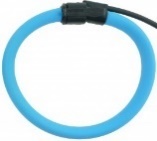 DENT 16” RoCoil Flexible Rope Current Transformers (CT-R16-A4-U) | Provides a measurement of true RMS power from voltage and current inputs and records long-term power (kW) and energy (kWh) measurements. Requires ELOG19 software and a USB connection cable for programming and downloading data files. |
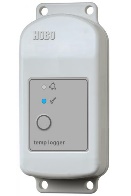 Onset HOBO Temperature/Relative Humidity Weatherproof Data Logger (MX2301) | Records outdoor air temperature and relative humidity using internal sensors. Requires HOBOware software and a USB connection cable for programming and downloading data files. |
Measurement Strategies
The following instructions have been developed for each measurement strategy discussed in this guide. While these instructions are reasonably detailed, certain aspects of each strategy may need to be modified based on the specific system configuration at each facility. Early surveying of the facility is useful when tailoring each strategy to unique site conditions.
The measurement recommendations reference supplementary equipment guides, which can be found in Appendix A.
- A.1: Onset HOBO Motor On/Off Data Logger (UX90-004)
- A.2: Fluke 345 Clamp Meter
- A.3: DENT ELITEpro XC Power Meter
- A.4: Onset HOBO 4-Channel Analog Logger (UX120-006M) and Onset Split-Core AC Current Sensor
- A.7: Onset HOBO Temperature/Relative Humidity Data Logger (MX2301)
Measurement for Constant Speed Constant Volume Pumps- On/Off Operation
This measurement approach is intended to be used for a constant speed, constant volume system configuration.
STEP 1: Preparation for Data Acquisition
- Confirm site conditions and locations to place data acquisition equipment and take spot measurements.
- Obtain measurement equipment from NYC Energy Tools:
- HOBHO Motor On/Off Data Logger (UX90-004)
- Fluke 345 Power Quality Clamp Meter (Fluke 345)
- Refer to Appendix A.1: Onset HOBO Motor On/Off Data Logger (UX90-004)
- Set up and deploy data logger per the instructions in sections A.1.1 to A.1.3.
STEP 2: Installation at the site
- Implement appropriate safety procedures.
- Refer to Appendix A.2: Fluke 345 Clamp Meter
- Take a one-time measurement of true RMS power draw of the motor per the instructions in section A.2.1.
- Take a screenshot of the reading per the instructions in section A.2.2 (or, alternatively, a photograph using a cell phone).
- Refer to Appendix A.1: Onset HOBO Motor On/Off Data Logger (UX90-004)
- Install the motor on/off logger in the selected location and be sure the logger passes the calibration with the motor running per the instructions in sections A.1.4 and A.1.5.
- Initial field setup is now complete.
STEP 3: Verify Data is Being Collected
- Implement appropriate safety procedures.
- If possible, wait for the first recording period to pass during the installation at site; if not, return to the site as soon as possible to retrieve data from the logger to verify data collection. Do not remove the logger from the equipment.
- Refer to Appendix A.1: Onset HOBO Motor On/Off Data Logger (UX90-004)
- Confirm that the logger is collecting data and that system operation is being recorded per the instructions in section A1.6. Be careful not to stop the logger when downloading data.
- It is recommended that this step be repeated periodically during the measurement period.
STEP 4: Retrieve Data Acquisition Equipment and Download Data
- Implement appropriate safety procedures.
- Refer to Appendix A.1: Onset HOBO Motor On/Off Data Logger (UX90-004)
- Confirm that the logger has collected the required operational data per the instructions in section A.1.6. Do not yet remove the logger from the equipment. Be careful not to stop the logger when downloading data.
- Once data acquisition has been confirmed, stop the logger per the instructions in section A.1.7.
- Remove the data logger and return to NYC Energy Tools.
Measure Power Consumed at the Main Feed to the Motor Using a Data-logging Power Meter
This measurement approach is the preferred method for a variable speed system. A data-logging power meter is attached at the feed to the VFD. It can also be used for a constant speed, constant volume system configuration, in which case the measurement is taken at the switch panel to the motor.
STEP 1: Preparation for Data Acquisition
- Confirm site conditions and locations where data acquisition equipment will be placed.
- Obtain measurement equipment from NYC Energy Tools:
- For all systems:
- DENT ELITEproXC Portable Power Data Logger – (EXCUNC) with 16” Flexible Current Transformers (CTs) (DENT CT-R16-A4-U)
- For a system that is continuously variable with OAT:
- Onset HOBO Temperature/RH Data Logger (MX2301)
- For all systems:
- Refer to Appendix A.3: DENT ELITEproXC Portable Power Data Logger and, as necessary, Appendix A.7: Onset HOBO Temperature/RH Data Logger (MX2301)
- Set up and deploy data loggers per the instructions in sections A.3.1 and A.7.1 to A.7.3, respectively.
STEP 2: Installation at the Site
- Implement appropriate safety procedures.
- For a single or two-speed system refer to Appendix A.3: DENT ELITEproXC Portable Power Data Logger
- Install the DENT ELITEproXC Portable Power Data Logger using sections A.3.2 to A.3.3 as guidance.
- For a continuously variable system with OAT, also refer to Appendix A.7: Onset HOBO Temperature/Relative Humidity Weatherproof Logger (MX2301)
- Install the Temperature/Relative Humidity Weatherproof Data Logger using section A.7.4 as guidance.
- Initial field setup is now complete.
STEP 3: Verify Data is Being Collected
- Implement appropriate safety procedures.
- If possible, wait for the first recording period to pass during the installation at site; if not, return to the site as soon as possible to retrieve data from the logger to verify data collection. Do not remove the logger from the equipment.
- Refer to Appendix A.3: DENT ELITEpro XC Power Meter and, as necessary, Appendix A.7: Onset HOBO Temperature/ RH Data Logger (MX2301)
- Confirm that the ELITEpro XC power meter and Temperature/RH logger are collecting data and that system operation is being recorded per the instructions in sections A.3.4 and A.7.5, respectively. Be careful not to stop the meter when downloading data.
- It is recommended that this step be repeated periodically during the measurement period.
STEP 4: Retrieve Data Acquisition Equipment and Download Data
- Implement appropriate safety procedures.
- For a single or dual-speed system:
- Refer to Appendix A.3: DENT ELITEpro XC Power Meter
- Confirm that the ELITEpro XC power meter has collected the required operational data per the instructions in section A.3.4. Do not yet remove the meter from the equipment. Be careful not to stop the meter when downloading data.
- Once data acquisition has been confirmed, stop the logger per the instructions in section A.3.5.
- Refer to Appendix A.3: DENT ELITEpro XC Power Meter
- For a continuously variable system with OAT:
- a. Refer to Appendix A.3: DENT ELITEpro XC Power Meter and Appendix A.7: Onset HOBO Temperature/ RH Data Logger (MX2301)
- Confirm that the ELITEpro XC power meter and Temperature/RH logger have collected the required operational data per the instructions in section A.3.4 and A.7.5. Do not yet remove the loggers from the equipment. Be careful not to stop the loggers when downloading data.
- Once data acquisition has been confirmed, stop the loggers per the instructions in section A.3.4 and A.7.6, respectively.
- a. Refer to Appendix A.3: DENT ELITEpro XC Power Meter and Appendix A.7: Onset HOBO Temperature/ RH Data Logger (MX2301)
- Remove the data logger(s) and return to NYC Energy Tools.
Measure Current Supplied to the Motor at the Main Feed Using a Current Sensor
This measurement approach is intended as an alternative method for a VFD system. It can also be used for a constant speed, constant volume system configuration, where the measurement is taken at the switch panel to the motor instead of at the VFD. A one-time measurements of true RMS power and apparent current at known pump speed are recorded and used to create a correlation between true power and apparent current. Long-term measurements of apparent current are used to derive true RMS power over time.
STEP 1: Preparation for Data Acquisition
- Confirm site conditions and locations where data acquisition equipment will be placed.
- Obtain measurement equipment from NYC Energy Tools:
- Fluke 345 Power Quality Clamp Meter
- Onset HOBO 4-Channel Analog Logger (UX120-006M)
- Onset HOBO Split-Core Current Sensor
- Refer to Appendix A.4 Onset HOBO 4-Channel Analog Logger (UX120-006M) with Onset HOBO Split-Core Current Sensor
- Set up and deploy data logger per the instructions in sections A.4.1 to A.4.3.
STEP 2: Installation at the Site
- Implement appropriate safety procedures.
- Refer to Appendix A.4 Onset HOBO 4-Channel Analog Logger (UX120-006M) & Onset HOBO Split-Core Current Sensor
- Install the current sensors and analog logger using section A.4.4 as guidance.
- Working with the appropriate facility personnel, run the VFD at a five equal steps starting at the minimum VFD speed recommended by the operator (e.g. 20%, 40%, 60%, 80% and 100%), waiting long enough between ramping for the clamp meter to get stable true RMS power, apparent current, power factor, and voltage. This may require overriding two-way valves with the BAS system to maintain the setpoint pressure differential in the system.
- For each speed of the VFD, refer to Appendix A.2: Fluke 345 Clamp Meter:
- Take a one-time measurement of true RMS power draw of the motor, apparent current, power factor, and voltage per the instructions in section A.2.1.
- Take a screenshot of the reading per the instructions in section A.2.2 (or, alternatively, a photograph using a cell phone).
- For each speed of the VFD, refer to Appendix A.2: Fluke 345 Clamp Meter:
- If the pump is constant speed and constant volume, only one true power reading is needed.
- Initial field setup is now complete.
STEP 3: Verify Data is Being Collected
- Implement appropriate safety procedures.
- If possible, wait for the first recording period to pass during the installation at site; if not, return to the site as soon as possible to retrieve data from the logger to verify data collection. Do not remove the logger from the equipment.
- Refer to Appendix A.4: Onset HOBO 4-Channel Analog Logger (EX120-006M) & Onset Split Core AC Current Sensor
- Confirm that the logger is collecting data and that system operation is being recorded per the instructions in section A.4.5. Be careful not to stop the logger when downloading data.
- It is recommended that this step be repeated periodically during the measurement period.
STEP 4: Retrieve Data Acquisition Equipment and Download Data
- Implement appropriate safety procedures.
- Refer to Appendix A.4 Onset HOBO 4-Channel Analog Logger (UX120-006M) with Onset HOBO Split-Core Current Sensor
- Confirm that the logger has collected the required operational data per the instructions in section A.4.5. Do not yet remove the logger from the equipment. Be careful not to stop the logger when downloading data.
- Once data acquisition has been confirmed, stop the logger per the instructions in section A.4.6.
- Remove the data logger and return to NYC Energy Tools.
Alternate Strategy – Download Data from a BAS or a VFD
This measurement approach is intended to be used for a variable speed system that is controlled by a BAS or by a VFD with data trending and exporting capability.
STEP 1: Preparation for Data Acquisition
- Confirm that the system can record either motor speed (in RPM) or percentage of full speed (in percentage). If possible, also record true RMS power. In lieu of true RMS power, current, voltage, and power factor may still be available. In this case, true RMS power can be calculated.
- Work with the installer to program the VFD to record hourly average RPM or percent of full speed, as well was true RMS power (where possible).
- If the system cannot record true RMS power, obtain the following from NYC Energy Tools:
- Fluke 345 Power Quality Clamp Meter
STEP 2: Installation at the Site
- Note that, for this measurement approach, installation at the site will only be required if the system cannot record true RMS power.
- Implement appropriate safety procedures.
- Working with the appropriate facility personnel, ramp the VFD to various speeds at which the VFD is programmed to operate. This may require overriding two-way valves with the BAS system to maintain the setpoint pressure differential in the system.
- For each speed of the VFD, refer to Appendix A.2: Fluke Power Quality 345 Clamp Meter
- Take a one-time measurement of true RMS power draw of the motor, apparent current, power factor, and voltage per the instructions in section A.2.1.
- Take a screenshot of the reading per the instructions in section A.2.2. (or, alternatively, a photograph using a cell phone).
- For each speed of the VFD, refer to Appendix A.2: Fluke Power Quality 345 Clamp Meter
- Initial field setup is now complete.
STEP 3: Verify Data is Being Collected
- Implement appropriate safety procedures.
- If possible, wait for the first recording period to pass during the installation at site; if not, return to the site as soon as possible to retrieve data from the system. Do not stop the data recording process when downloading the data.
- Confirm that the data is being collected in the proper format, as required by the calculation spreadsheet.
- It is recommended that this step be repeated periodically during the measurement period.
STEP 4: Retrieve Data Acquisition Equipment and Download Data
- Implement appropriate safety procedures.
- Download data from the system for the duration of the measurement period.
- Format the data appropriately into Microsoft Excel spreadsheet for the calculation spreadsheet.
Calculation Methodology
Total annual energy (in kWh) is calculated using the general equation, below:
E\left[\frac{kWh}{year}\right]=\sum_{i}T_i [Hours] * P_i[kW]where,
E = electricity use of AHU fan motor in kW/year
i = bin index, or operational bin, as defined by load frequency distribution
Ti = total time that AHU is in each operational bin, in hours/year (note that operational bin can be defined by temperature ranges or scheduling characteristics)
Pi = average motor power draw for each operational bin, in kW
Five Microsoft Excel workbooks have been developed along with this guide to facilitate the calculation of total annual energy consumption from the measured data:
- Constant speed, constant volume pumps using a motor on/off logger – This workbook calculates annual consumption of pumps using spot measurements for true power and motor operational time per hour, as measured by motor on/off data loggers.
- Constant speed, constant volume pumps using data-logging power meter – This workbook calculates annual consumption using average hourly power draw in kW.
- Constant speed, constant volume pumps using current sensors – This workbook calculates annual consumption using hourly average current (in Amps) as directly measured by current sensors, and spot measurements for true power at both high and low speed operation.
- Variable speed, variable volume pumps using data-logging power meters – This workbook calculates annual consumption using average hourly power draw (kW) and the average hourly OAT as measured by a temperature/RH logger.
- Variable speed, variable volume pumps using speed data from BAS or VFD – This workbook calculates annual consumption using the hourly average motor speed (in RPM), as downloaded from a BAS or a VFD, and spot measurements for true power at both high and low speeds.
Instructions are included in each workbook that detail how to input data and how to interpret and make use of the results. Specific calculation methodologies can be found in Appendix A.18: Secondary Chilled Water Pump Calculations and are captured in the workbooks.
Reporting Recommendations
As part of the documentation of expected avoided energy use, the integration of measurements and calculation methodology discussed in this guide will serve to enhance these projections. To facilitate transparency and data quality control, the following pieces of information should be documented to accompany expected savings calculations:
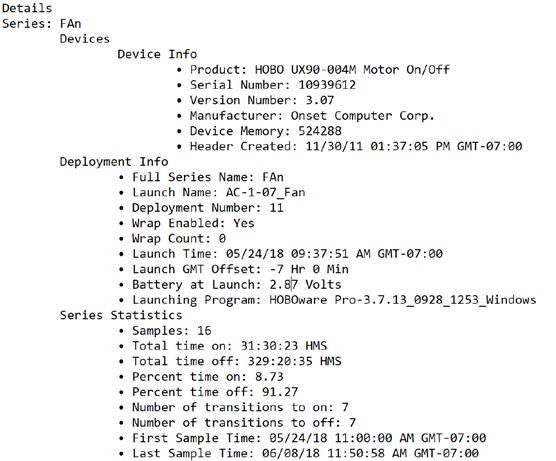
- Measurement tool information and dates of measurement. The HOBOware software records logger information (such as product, serial number, and version number) as well as deployment and measurement dates. To export this information, use the software to open the logger data file, then select “Export Details” from the File menu; this will produce a text file like the one shown in Figure 9. Repeat for all data loggers that were deployed and include all files with the funding application.
- If a BAS was used to collect any of the information discussed in this guide, submit a brief description of the system, including:
- BAS manufacturer and model
- BAS software and version number
- Measurement dates
- Most recent date of sensor calibration (if a sensor was used)
- The completed workbook(s) containing measured data.
It is expected that the user will be responsible for measuring the system of interest and compiling the data input to the calculation tools. The output of these tools can be directly used to satisfy reporting requirements.