Cooling Tower Fan Measurement Guide
Published: June 24, 2020
By: Phillip Chao, PhD | Applied Research Scientist, Peter Phung, Tom Lui | Interns, Duncan Prahl, RA, AIA | Sr. Applied Research Scientist
Reviewed by: Jillian Panagakos | Jr. Engineer, Honey Berk, LEED AP O&M,CMVP | Managing Director
Helpful Resources
Download this Guide
DownloadGeneral System Overview
This guide describes the measurement approach for quantifying avoided energy use associated with retrofitting evaporative cooling tower fans with variable frequency drives (VFDs).
Safety
This guide does not cover health and safety aspects of the collection of measurements at facilities. There are many hazards that exist in facilities surrounding the collection of measurements, including but not limited to: electrical safety, fall protection, personal protective equipment, control of hazardous energy (lock out/ tag out), confined space, respiratory protection, and machine safeguarding. Part of the measurement planning process must include the identification and mitigation of these and other hazards. The implementation of a measurement strategy and installation of measurement equipment should be performed by qualified personnel.
Description of System
The following sections provide background information on the components of an evaporative cooling tower. If you are already familiar with the system, you may skip to the Measurement Description for System section.
System Overview
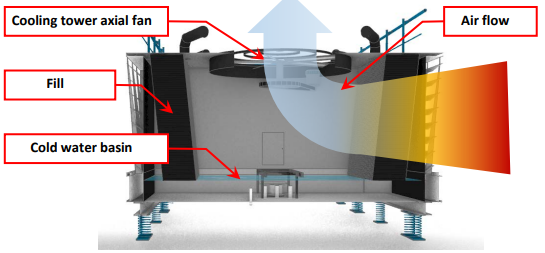
An evaporative cooling tower is part of a larger chiller system and is where heat is rejected that has been removed from the building by the chiller. Generally, a cooling tower is comprised of a water distribution deck (or spray system), fill material (or a coil), one or more fans, drift eliminators, and a cold water basin. Water is distributed at the top of the tower, and the surface area of the water is maximized by breaking the water down into many tiny droplets in the fill material or across the coil. A fan is used to move large quantities of air through the fill (or over the coil) and some of the droplets evaporate, which removes heat from the remaining water droplets. The cooler water falls into the cold-water basin. A schematic of an open, induced-draft crossflow cooling tower is provided in Figure 1.
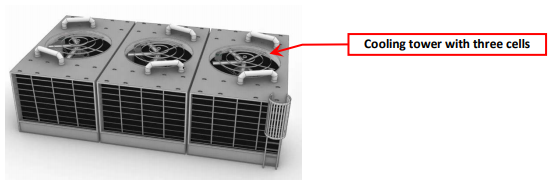
Because cooling loads vary throughout the day and year, multiple cooling tower cells are combined to allow for staging of towers based on cooling demand. An example of a multi-cell cooling tower is shown in Figure 2.
There are a wide range of cooling tower designs and components, some of which are discussed below:
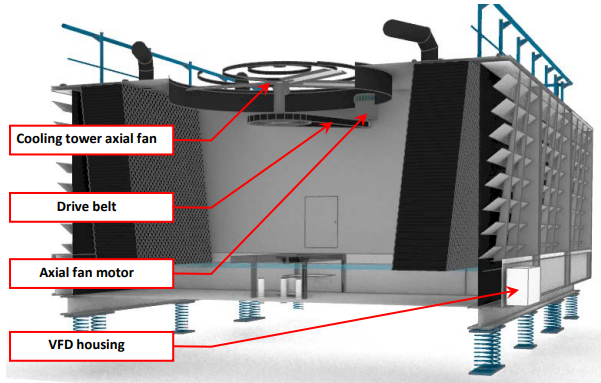
Open vs. Closed: In an open (direct) cooling tower, the actual condenser water is evaporated in direct contact with the air. This strategy requires chemical treatment and freeze protection or draining during a winter shutdown. A cross section diagram of an open cooling tower with a VFD is shown in Figure 3.
A closed (indirect) cooling tower contains the condenser water within a coil, as shown in Figure 4. A separate source of water is evaporated on the surface of the coil to cool the condenser water. Closed towers are used where the indoor condenser coils are inaccessible for periodic cleaning, such as a packaged water-source heat pump loop.
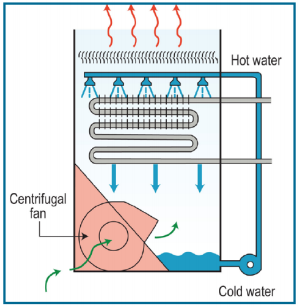
Induced-Draft vs. Forced-Draft: Induced-draft cooling towers have axial fans located at the top of the cooling tower that pull air up through the tower. Forced-draft towers have fans, typically centrifugal, located at the base that push air up into the cooling tower.
Axial Fans vs. Centrifugal Fans: Induced-draft towers exclusively use axial fans; while, forced draft towers may have either centrifugal or axial fans. Axial fans are typically more efficient than centrifugal fans, but they are noisier. In addition, if there are height restrictions, centrifugal fans can be configured to reduce overall tower heights.
Crossflow vs. Counterflow: A crossflow design brings in air at the side of the tower, where it crosses the falling droplets of water. A counterflow design brings in air at the bottom and it flows straight up, counter to the direction of the falling water droplets.
Since this guide is focused on measuring fan energy consumption, the measurement techniques are suitable for all variations in cooling tower design – open/closed, induced-/forced-draft, axial/centrifugal fans, and crossflow/counterflow. It is not, however, intended to measure other variables (e.g., flow rate, approach temperature) that can further optimize overall chiller system operational efficiency.
Key Variables Associated with Calculating Energy Consumption of an AHU Fan Motor
The primary energy source for fan motors is electricity, measured in kWh. The power draw will vary depending on the operating conditions and operating rules, which are discussed in detail in the “Operating Characteristics” section. The relevant variables used to characterize the electricity consumption of both fan and pump motors are:
- Power draw of the motors (kW)
- Operating schedule and the coincidence of wet-bulb temperature (˚F)
For constant speed motors, the overall air flow rate is modulated by staging the fans. For variable speed fan motors, all the fans are operated at the same speed. The speed of the fans, and therefore the power draw of the motors, is modulated to maintain a certain setpoint, usually the condenser water entering temperature (i.e., temperature of water leaving the cooling tower) that is determined by the building operator based on other chiller system operation variables.
Operating Characteristics
This guide covers evaporative cooling towers. The ECM is the installation of VFDs on the fan motors. In the pre-retrofit condition, a single- or two-speed fan in each cooling tower cell is run at a constant speed. There are a number of operating modes for a cooling tower, based upon how much variation is possible with the fan speeds. Cells are turned on or off depending on how much cooling is needed in the building. With two-speed fans, operational optimization occurs by staging each cell to turn on sequentially at low speed until all cells are on, and then begin turning the fans to full speed as the load increases. With single-speed fans, each cell is turned on as the load increases.
In a retrofit with VFDs, the fans in all cells are run simultaneously and their speed is modulated based on the cooling load. As fan power is the cube of the fan speed, energy can be saved by running the fans at lower speeds. The speed modulation is controlled in three possible modes: 1) to keep the condenser water entering temperature constant; 2) to keep the approach temperature1 constant; and 3) to minimize overall system power consumption. This guide only covers the measurement of energy consumption with respect to maintaining a constant condensing water entering temperature.
Regardless of the operating sequence of the cells or the speed of the fans, there is usually a minimum water flow per cell and minimum flow per chiller that must be maintained. This guide assumes that the pre- and post-retrofit flow rates through the cooling tower do not change, as would be expected if a VFD was installed on the condenser water pump at the same time as the VFDs on the fans.
Scope of This Guide
The profile of energy consumption and savings associated with three types of ECMs can be characterized using this guide:
- High-Efficiency Motor Upgrade – Replacing an existing motor with a premium efficiency motor can yield avoided energy use by increasing the useful work output per unit of electricity consumed.
- Two-Speed Motor Upgrade – Replacing a single speed motor with a two-speed motor and properly sequencing cell and fan staging can yield avoided energy use by more closely matching the cooling fan power consumption to the building’s cooling load requirement.
- VFD Installation – Avoided energy use can be achieved by replacing single- or two-speed systems with variable speed systems
This document is designed to assist in gathering both pre- and post-retrofit data for the electricity consumption of cooling tower fans. As such, a primary goal is to describe the data that should be collected through measurements and the appropriate equipment to perform those measurements. Guidance is provided for measuring both constant and variable speed cooling tower fan motors. No guidance is provided on measuring and quantifying the cooling energy consumption between pre- and post-retrofit conditions.
The optimal design and operation of a cooling tower in combination with a chiller is a balance between cooling tower fan power, condenser water pump power, and compressor power. Changing cooling tower fans to variable speed enables a variable speed compressor in the chiller to operate at lower speeds. While a VFD ECM can lead to energy savings across the chiller-cooling tower system, this guide only describes how to measure the energy consumption in the cooling tower fans.
Measurements
Measurement Approach
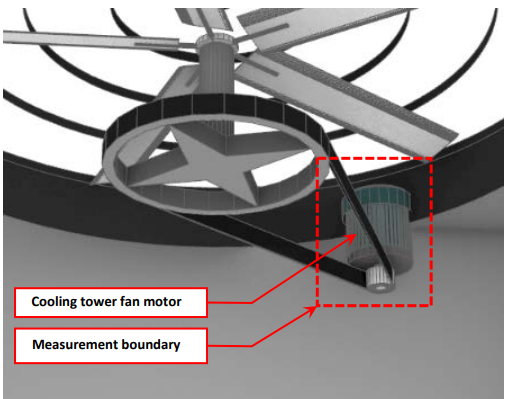
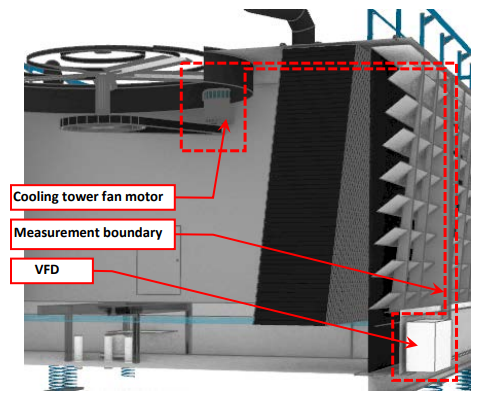
This guide is focused on characterizing the electricity savings associated with the installation of VFDs on the fans of an evaporative cooling tower. As such, the measurement boundary of the system, per this guide, is defined as the fan motors plus the associated VFD, if one is installed. Figure 5 and Figure 6 illustrate the measurement boundaries used within the confines of this guide.
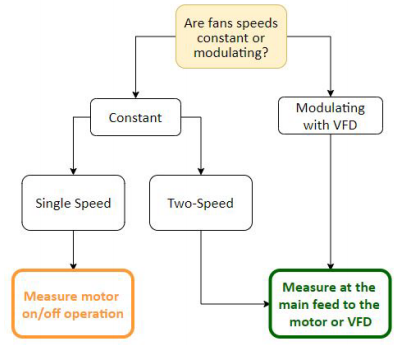
The measurement strategy for this system is determined by whether the fans are operated at a constant speed or modulated with a VFD. Figure 7 illustrates a decision tree that can be used to determine which measurement strategy to apply to a specific system, based upon its configuration and components.
Measure Motor On/Off Operation
For the cooling tower fans, measuring motor on/off operation is the approach for pre-retrofit constant speed fans and for the post-retrofit condition when changing to a higher efficiency motor. This measurement approach assumes that the power draw stays constant throughout the measurement period. Because the motor operates at constant speed, it is either running at full power (when turned on) or it is drawing no power (when turned off). As such, a motor on/off data logger is used to record the operating schedule.
The following parameters should be measured for all of the fans in the cooling tower:
- True RMS power of the motor that drives the fan, kW
- Fan motor runtime, seconds
If it is not possible to determine whether the fan motors have a constant power draw (e.g., through physical observation of the system, an interview with the building operator, or review of as-built drawings), it is best to derive runtime and power by using the alternate measurement strategy that follows.
Measure at the Main Feed to the Two-Speed Motor or VFD
This measurement approach is a direct or proxy measurement of power (e.g., measuring current) to characterize how fan power varies with operational schedule and with wet-bulb temperature. Because fan power is proportional to the cube of the speed, it is important to measure power over the full range of loading conditions. Several weeks of measurements backed up by documentation showing the programming in the controller is generally sufficient for constant speed fans. For modulating fans (either two-speed or continuously variable), at least four to six weeks during the hottest time of summer and a few weeks during spring or fall should be sufficient to capture the operation of the system with respect to the operational schedule and wet-bulb temperature.
Typically, a cooling tower will have one fan per cell. For constant speed fans, either each fan should be measured or the feed to all the motors should be measured, to fully characterize the operation of the cooling tower cells. If the fans are modulated (assuming they all run at the same speed), then only one fan needs to be measured, provided substantiating documentation from the building automation system (BAS) shows that all cells are operating equally at the same time. If fans are further staged, all fans should be measured.
Measurement Tools and Equipment
The measurements in this guide can be performed with the equipment listed in Table 1; more detailed descriptions have been provided in Table 2. NYC agency employees can borrow recommended equipment from NYC Energy Tools, and have it delivered to their facility. Third-party M&V consultants and others can use this equipment list as guidance, recognizing that many manufacturers make comparable equipment. Inclusion on the list in Table 1 and Table 2 should not be construed as an endorsement of these manufacturers.
| Measurement | Units | Tool | Equipment |
|---|---|---|---|
| True RMS Power | kW | Clamp Meter | Fluke 345 Power Quality Clamp Meter |
| Apparent Current | Amperes | Current Sensor and Data Logger | Onset HOBO Split-Core Current Sensor Onset HOBO 4-Channel Analog Data Logger (UX120-006M) |
| True RMS Energy | kWh | Data-logging Power Meter and Current Transformers | DENT ELITEproXC Portable Power Data Logger (EXCUNC) Dent 16” RoCoil Flexible Rope Current Transformers (CT-R16-A4-U) |
| Motor Runtime | Seconds / Hour | Motor On/Off Logger | Onset HOBO Motor On/Off Data Logger (UX90-004) |
| OAT (i.e., dry-bulb temperature) | °F | Weatherproof Temperature/Relative Humidity Data Logger | Onset HOBO Temperature/Relative Humidity Weatherproof Data Logger (MX2301) |
| Relative Humidity | % | Weatherproof Temperature/Relative Humidity Data Logger | Onset HOBO Temperature/Relative Humidity Weatherproof Data Logger (MX2301) |
| Equipment | Description |
|---|---|
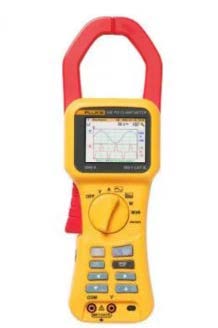 Fluke 345 Power Quality Clamp Meter | Multi-purpose electrical measurement tool used to take true RMS power readings over a short period of time. |
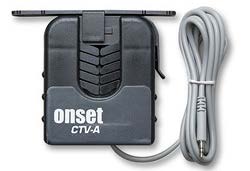 Onset HOBO Split-Core Current Sensor | Provides a measurement of the current flowing through a conductor and converts to a signal the U12- or UX120-series data logger can record. Rated for specific amperage ranges – CTV-A 2-20 amps, CTV-B 5-50 amp or CTV-C 10-100 amp). Sensor should be selected based on the maximum or minimum amperage anticipated to be measured, to avoid out of range readings. |
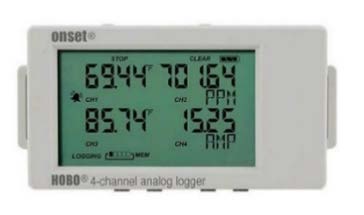 Onset HOBO 4-Channel Analog Data Logger (UX120-006M) | Used in conjunction with the CTV series of sensors. Records measurements from up to four CTV sensors. Requires HOBOware software and a USB connection cable for programming and downloading data files. |
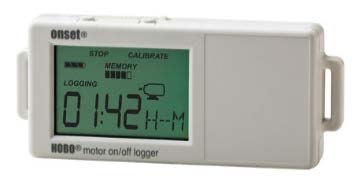 Onset HOBO Motor On/Off Data Logger (UX90-004) | Records when a motor is on and off, as well as runtime. Requires HOBOware software and a USB connection cable for programming and downloading data files. |
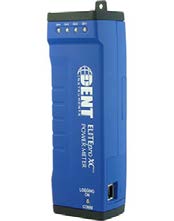 DENT ELITEproXC Portable Power Data Logger (EXCUNC)  DENT 16” RoCoil Flexible Rope Current Transformers (CT-R16-A4-U) | Provides a measurement of true RMS power from voltage and current inputs and records long-term power (kW) and energy (kWh) measurements. Requires ELOG19 software and a USB connection cable for programming and downloading data files. |
 Onset HOBO Temperature/Relative Humidity Weatherproof Data Logger (MX2301) | Records outdoor air temperature and relative humidity using internal sensors. Requires HOBOware software and a USB connection cable for programming and downloading data files. |
Measurement Strategies
The following instructions have been developed for each measurement strategy discussed in this guide. While these instructions are reasonably detailed, certain aspects of each strategy may need to be modified based upon the specific system configuration at each facility. Early surveying of the facility is useful when tailoring each strategy to unique site conditions.
The measurement recommendations reference supplementary equipment guides, which can be found in Appendix A.
A.1: Onset HOBO Motor On/Off Data Logger (UX90-004)
A.2: Fluke 345 Power Quality Clamp Meter
A.3: DENT ELITEproXC Portable Power Data Logger
A.4: Onset HOBO 4-Channel Analog Logger (UX120-006M) with Onset HOBO Split-Core Current Sensor
A.7: Onset HOBO Temperature/Relative Humidity Weatherproof Data Logger (MX2301)
Measure Motor On/Off Operation
This measurement approach is intended for constant speed, constant volume system configurations.
STEP 1: Preparation for Data Acquisition
- Confirm site conditions and locations where data acquisition equipment will be placed.
- Obtain measurement equipment from NYC Energy Tools:
- Onset HOBO Motor On/Off Data Logger (UX90-004)
- Fluke 345 Power Quality Clamp Meter
- Refer to A.1: Onset HOBO Motor On/Off Data Logger (UX-90-004)
- Set up and deploy data logger per the instructions in sections A.1.1 to A.1.3.
STEP 2: Installation at the Site
- Implement appropriate safety procedures.
- Refer to A.2: Fluke 345 Power Quality Clamp Meter
- Take a one-time measurement of true RMS power draw of the motor per the instructions in section A.2.1.
- Take a screenshot of the reading per the instructions in section A.2.2 (or, alternatively, a photograph using a cell phone).
- Refer to A.1: Onset HOBO Motor On/Off Data Logger (UX90-004)
- Install the motor on/off logger in the selected location and be sure the logger passes the ion with the motor running per the instructions in sections A.1.4 and A.1.5.
- Initial field setup is now complete.
STEP 3: Verify Data is Being Collected
- Implement appropriate safety procedures.
- If possible, wait for the first recording period to pass during the installation at site; if not, return to the site as soon as possible to retrieve data from the logger to verify data collection. Do not remove the logger from the equipment.
- Refer to Appendix A.1: Onset HOBO Motor On/Off Data Logger (UX90-004)
- Confirm that the logger is collecting data and that system operation is being recorded per the instructions in section A1.6. Be careful not to stop the logger when downloading data.
- It is recommended that this step be repeated periodically during the measurement period.
STEP 4: Retrieve Data Acquisition Equipment and Download Data
- Implement appropriate safety procedures.
- Refer to Appendix A.1: Onset HOBO Motor On/Off Data Logger (UX90-004)
- Confirm that the logger has collected the required operational data per the instructions in section A.1.6. Do not yet remove the logger from the equipment. Be careful not to stop the logger when downloading data.
- Once data acquisition has been confirmed, stop the logger per the instructions in section A.1.7.
- Remove the data logger and return to NYC Energy Tools.
Measure Power Consumed at Main Feed to Motor or VFD Using Data-logging Power Meter
This approach is the preferred method for a variable speed system (i.e., either two-speed or modulating with OAT), in which case a data-logging power meter (e.g., DENT ELITEproXC Portable Power Data Logger) is attached at the feed to the VFD. It can also be used for a constant speed, constant volume system configuration, in which case the measurement should be taken at the motor switch panel.
STEP 1: Preparation for Data Acquisition
- Confirm site conditions and locations where data acquisition equipment will be placed.
- For a single- or two-speed system:
- Obtain measurement equipment from NYC Energy Tools:
- DENT ELITEproXC Portable Power Data Logger – (EXCUNC) with 16” Flexible Current Transformers (CTs) (DENT CT-R16-A4-U)
- Obtain measurement equipment from NYC Energy Tools:
- Refer to Appendix A.3: DENT ELITEproXC Portable Power Data Logger
- Set up and initialize the DENT logger per the instructions in section A.3.1.
- For a continuously variable system with OAT:
- Obtain measurement equipment from NYC Energy Tools:
- DENT ELITEproXC Portable Power Data Logger– (EXCUNC) with 16” Flexible CTs (DENT CT-R16-A4-U)
- If the AHU varies air volume based on OAT, also use the Onset HOBO Temperature/Relative Humidity Weatherproof Data Logger (MX2301)
- Obtain measurement equipment from NYC Energy Tools:
- Refer to Appendix A.3: DENT ELITEproXC Portable Power Data Logger
- Set up and initialize the DENT logger per the instructions in sections A.3.1.
- Refer to Appendix A.7: Onset HOBO Temperature/Relative Humidity Weatherproof Data Logger (MX2301)
- Set up and initialize the Temperature/Relative Humidity Weatherproof Data Logger, per the instructions in sections A.7.1 through A.7.3.
STEP 2: Installation at the Site
- Implement appropriate safety procedures.
- For a single or two-speed system refer to Appendix A.3: DENT ELITEproXC Portable Power Data Logger
- Install the DENT ELITEproXC Portable Power Data Logger using sections A.3.2 to A.3.3 as guidance.
- For a continuously variable system with OAT refer to Appendix A.3: DENT ELITEproXC Portable Power Data Logger and Appendix A.7: Onset HOBO Temperature/Relative Humidity Weatherproof Logger (MX2301)
- Install the DENT ELITEproXC Portable Power Data Logger using sections A.3.2 to A.3.3 as guidance.
- Install the Temperature/Relative Humidity Weatherproof Data Logger using section A.7.4 as guidance.
- Initial field setup is now complete.
STEP 3: Verify Data is Being Collected
- Implement appropriate safety procedures.
- If possible, wait for the first recording period to pass during the installation at site; if not, return to the site as soon as possible to retrieve data from the logger to verify data collection. Do not remove the logger from the equipment.
- For a single or two-speed system refer to Appendix A.3: DENT ELITEproXC Portable Power Data Logger
- Confirm that the DENT ELITEproXC Portable Power Data Logger is collecting data and that system operation is being recorded per the instructions in section A.3.4. Be careful not to stop the meter when downloading data.
- For a continuously variable system with OAT refer to Appendix A.3: DENT ELITEproXC Portable Power Data Logger and Appendix A.7: Onset HOBO Temperature/Relative Humidity Weatherproof Logger (MXX2301)
- Confirm that the DENT ELITEproXC Portable Power Data Logger and Onset HOBO Temperature/Relative Humidity Weatherproof Data Logger (MX2301) are collecting data and that system operation is being recorded per the instructions in sections A.3.4 and A.7.5, respectively. Be careful not to stop the loggers when downloading data.
- It is recommended that this step be repeated periodically during the measurement period.
STEP 4: Retrieve Data Acquisition Equipment and Download Data
- Implement appropriate safety procedures.
- For a single or two-speed system refer to Appendix A.3: DENT ELITEproXC Portable Power Data Logger
- Confirm that the DENT ELITEproXC Portable Power Data Logger has collected the required data per the instructions in section A.3.4. Do not yet remove the meter from the equipment. Be careful not to stop the meter when downloading data.
- Once data acquisition has been confirmed, stop the logger per the instructions in section A.3.5.
- For a continuously variable system with OAT refer to Appendix A.3: DENT ELITEproXC Portable Power Data Logger and Appendix A.7: Onset HOBO Temperature/Relative Humidity Weatherproof Logger (MX2301)
- Confirm that the DENT ELITEproXC Portable Power Data Logger and Temperature/Relative Humidity Weatherproof Data Logger have both collected the required data per the instructions in sections A.3.4 and A.7.5, respectively. Do not yet remove the loggers from the equipment. Be careful not to stop the loggers when downloading data.
- Once data acquisition has been confirmed, stop the loggers per the instructions in section A.3.5 and A.7.6, respectively.
- Remove the data logger and return to NYC Energy Tools.
Measure Current Supplied to Motor at Main Feed to VFD Using Current Sensor
This measurement approach is intended as an alternative method for either a constant- or variable-speed motor (either two-speed or continuous variable-speed operation) where the measurement is taken at the switch panel or at the main feed to the VFD. For constant-speed motors, the current is a 17 proxy for on/off motor operation. This method is to be used when a DENT ELITEpro XC Portable Power Data Logger (or equivalent) is not available or cannot be installed due to space or other constraints.
For constant-speed motors:
- Take one-time true RMS power, voltage, apparent current, and power factor measurements with a Fluke 345 Clamp Meter (or equivalent).
- Record the long-term apparent current being drawn by the motor with a current sensor and analog data logger on one or all the conductors that serve the motor.
For two-speed operation:
- Ask the facility representative to set the motor to run at the low speed setting. Take one-time true RMS power, voltage, apparent current and power factor measurements with a Fluke 345 Clamp Meter (or equivalent). Repeat at the high-speed setting.
- Record the long-term apparent current being drawn by the motor with a current sensor and analog data logger on one or all the conductors that serve the motor.
For continuously variable-speed operation:
- Ask the facility representative to set the motor to run at four speed settings: maximum speed, 75% speed, 50% speed, and 25% speed. Take one-time true RMS power, voltage, apparent current and power factor measurements with a Fluke 345 Clamp Meter (or equivalent) at each speed setting.
- Record the long-term apparent current being drawn by the motor with a current sensor and analog data logger on one or all the conductors that serve the motor.
STEP 1: Preparation for Data Acquisition
- Confirm site conditions and locations where data acquisition equipment will be placed.
- Obtain measurement equipment from NYC Energy Tools:
- Fluke 345 Power Quality Clamp Meter
- Onset HOBO 4-Channel Analog Logger (UX120-006M)
- Onset Split Core AC Current Sensors (CTV-A, B, or C)
- Refer to Appendix A.4 Onset HOBO 4-Channel Analog Logger & Onset HOBO Split-Core AC Current Sensor
- Set up and deploy data logger per the instructions in sections A.4.1 to A.4.3.
STEP 2: Installation at the Site
- Implement appropriate safety procedures.
- Refer to Appendix A.4 Onset HOBO 4-Channel Analog Logger & Onset HOBO Split-Core AC Current Sensor
- Install the current sensors and analog logger using section A.4.4 as guidance.
- Refer to Appendix A.2: Fluke 345 Clamp Meter:
- For constant-speed motors:
- Take a one-time measurement of true RMS power draw of the motor, apparent current, power factor, and voltage per the instructions in section A.2.1.
- Take a screenshot of the reading per the instructions in section A.2.2 (or, alternatively, a photograph using a cell phone).
- For continuously variable-speed motors:
- Working with the appropriate facility personnel, set the VFD to the four speeds (25%, 50%, 75%, 100%).
- For each speed, take a one-time measurement of true RMS power draw of the motor, apparent current, power factor, and voltage per the instructions in section A.2.1.
- Take a screenshot of the reading per the instructions in section A.2.2 (or, alternatively, a photograph using a cell phone).
- For constant-speed motors:
- Initial field setup is now complete.
STEP 3: Verify Data is Being Collected
- Implement appropriate safety procedures.
- If possible, wait for the first recording period to pass during the installation at site; if not, return to the site as soon as possible to retrieve data from the logger to verify data collection. Do not remove the logger from the equipment.
- Refer to Appendix A.4 Onset HOBO 4-Channel Analog Logger (UX0-006M) with Onset HOBO Split-Core Current Sensor
- Confirm that the logger is collecting data and that system operation is being recorded per the instructions in section A.4.5. Be careful not to stop the logger when downloading data.
- It is recommended that this step be repeated periodically during the measurement period.
STEP 4: Retrieve Data Acquisition Equipment and Download Data
- Implement appropriate safety procedures.
- Refer to Appendix A.4 Onset HOBO 4-Channel Analog Logger (UX120-006M) with Onset HOBO Split-Core Current Sensor
- Confirm that the logger has collected the required operational data per the instructions in section A.4.5. Do not yet remove the logger from the equipment. Be careful not to stop the logger when downloading data.
- Once data acquisition has been confirmed, stop the logger per the instructions in section A.4.6.
- Remove the data logger and return to NYC Energy Tools.
Alternate Strategy: Download Data Directly from a BAS or VFD
This measurement approach is intended to be used for a two-speed VFD system that is controlled by a BAS or by a VFD with data-trending and exporting capability.
STEP 1: Preparation for Data Acquisition
- Confirm that the system can record either motor speed (in RPM) or percentage of full speed (in percentage). If possible, also record true RMS power. In lieu of true RMS power, current, voltage, and power factor may still be available. In this case, true RMS power can be calculated.
- Work with the installer to program the VFD to record hourly average RPM or percent of full speed, as well was true RMS power (where possible).
- If the system cannot record true RMS power, obtain the following from NYC Energy Tools:
- Fluke 345 Power Quality Clamp Meter
STEP 2: Installation at the Site
- Note that, for this measurement approach, installation at the site will only be required if the system cannot record true RMS power.
- Implement appropriate safety procedures.
- Working with the appropriate facility personnel, ramp the VFD to various speeds at which the VFD is programmed to operate.
- For each speed of the VFD, refer to Appendix A.2: Fluke Power Quality 345 Clamp Meter
- Take a one-time measurement of true RMS power draw of the motor, apparent current, power factor, and voltage per the instructions in section A.2.1.
- Take a screenshot of the reading per the instructions in section A.2.2. (or, alternatively, a photograph using a cell phone).
- For each speed of the VFD, refer to Appendix A.2: Fluke Power Quality 345 Clamp Meter
- Initial field setup is now complete.
STEP 3: Verify Data is Being Collected
- Implement appropriate safety procedures.
- If possible, wait for the first recording period to pass during the installation at site; if not, return to the site as soon as possible to retrieve data from the system. Do not stop the data recording process when downloading the data.
- Confirm that the data is being collected in the proper format, as required by the calculation spreadsheet.
- It is recommended that this step be repeated periodically during the measurement period.
STEP 4: Retrieve Data Acquisition Equipment and Download Data
- Implement appropriate safety procedures.
- Download data from the system for the duration of the measurement period.
- Make sure the data is formatted appropriately for the calculation spreadsheet.
Calculation Methodology
General
Total annual energy (in kWh) is calculated using the general equation, below:
E\left[\frac{kWh}{year}\right]=\sum_{i}T_i [Hours] * P_i[kW]where,
E = electricity use of AHU fan motor in kW/year
i = bin index, or operational bin, as defined by load frequency distribution
Ti = total time that AHU is in each operational bin, in hours/year (note that operational bin can be defined by temperature ranges or scheduling characteristics)
Pi = average motor power draw for each operational bin, in kW
Microsoft Excel workbooks have been developed along with this guide to facilitate the calculation of total annual energy consumption from the measured data:
- Constant-speed fans using a motor on/off logger – The input data for this workbook is spot measurements for true power and motor operational time per hour, as measured by motor on/off loggers.
- Constant speed or two-speed, constant volume fans using data logging power meter – The input data for this workbook is average hourly power draw (in kW) as measured by a DENT power logger.
- Constant-speed fans using current sensors – The input data for this workbook is current using hourly average current (in amperes), as directly measured by current sensors, and spot measurements for true power at constant speed
- Variable-speed fans using data-logging power meter – The input data for this workbook is average hourly power draw (in kW), as measured by a DENT power logger, and average hourly OAT, as measured by a temperature/RH logger.
Instructions are included in each workbook that detail how to input data and how to interpret and make use of the results. Specific calculation methodologies can be found in Appendix A.15: Cooling Tower Fan Calculations and are captured in the workbooks. Click on the workbook name to download.
Reporting Recommendations
As part of the documentation of expected avoided energy use, the integration of measurements and calculation methodology discussed in this guide will serve to enhance these projections. To facilitate transparency and data quality control, the following pieces of information should be documented to accompany expected savings calculations:
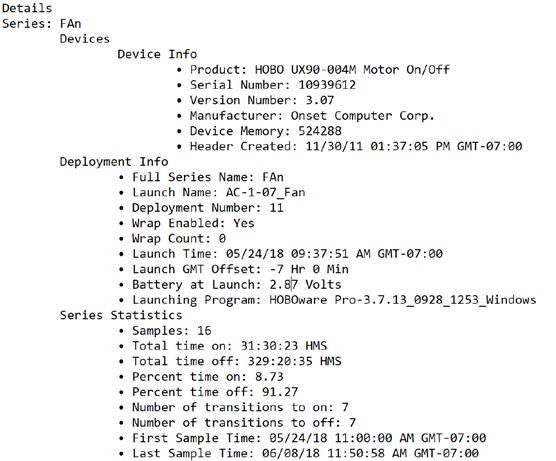
- Measurement tool information and dates of measurement. The HOBOware software records logger information (such as product, serial number, and version number) as well as deployment and measurement dates. To export this information, use the software to open the logger data file, then select “Export Details” from the File menu; this will produce a text file like the one shown in Figure 5. Repeat for all data loggers that were deployed and include all files with the funding application.
- If a BAS was used to collect any of the information discussed in this guide, submit a brief description of the system, including:
- BAS manufacturer and model
- BAS software and version number
- Measurement dates
- Most recent date of sensor calibration (if a sensor was used)
- The completed workbook(s) containing measured data.
It is expected that the user will be responsible for measuring the system of interest and compiling the data input to the calculation tools. The output of these tools can be directly used to satisfy reporting requirements.