AHU Fans Measurement Guide
Published: June 24, 2020
By: Phillip Chao, PhD | Applied Research Scientist, Peter Phung, Tom Lui | Interns, Duncan Prahl, RA, AIA | Sr. Applied Research Scientist
Reviewed by: Jillian Panagakos | Jr. Engineer, Honey Berk, LEED AP O&M,CMVP | Managing Director
Helpful Resources
Download this Guide
DownloadGeneral System Overview
This guide describes the measurement approach for quantifying avoided energy use associated with retrofitting supply and return fans in air handling units (AHUs) with variable frequency drives (VFDs) and/or more efficient motors.
Safety
This guide does not cover health and safety aspects of the collection of measurements at facilities. There are many hazards that exist in facilities surrounding the collection of measurements, including but not limited to: electrical safety, fall protection, personal protective equipment, control of hazardous energy (lock out/ tag out), confined space, respiratory protection, and machine safeguarding. Part of the measurement planning process must include the identification and mitigation of these and other hazards. The implementation of a measurement strategy and installation of measurement equipment should be performed by qualified personnel.
Description of System
The following sections provide background information on the components of an AHU. If you are already familiar with the system, you may skip to the Measurement Description for System section.
System Overview
An AHU provides conditioned air to the spaces it serves. This may include one or more of the following:
- Space heating
- Space cooling
- Ventilation
- Humidification
- Dehumidification
- Filtration
The primary components of an AHU are listed below and shown in Figure 1.
- The supply/return fan maintains the air flow rate and pressure in the ductwork of the building.
- Heating and cooling coils condition the discharge air to a desired setpoint temperature.
- Dampers at the outdoor air intake, exhaust, and return air points control the amount of outdoor air, exhaust air, and return air in the AHU, respectively. Depending on ventilation requirements and the need to positively or negatively pressurize the building, some or all of the return air is mixed with the outdoor air.
- Filters remove particulates from the mixed air.
- Sensors and controls enable the operation of the AHU to meet specified comfort or outdoor air requirements. These may be standalone devices or integrated into a building automation system (BAS).
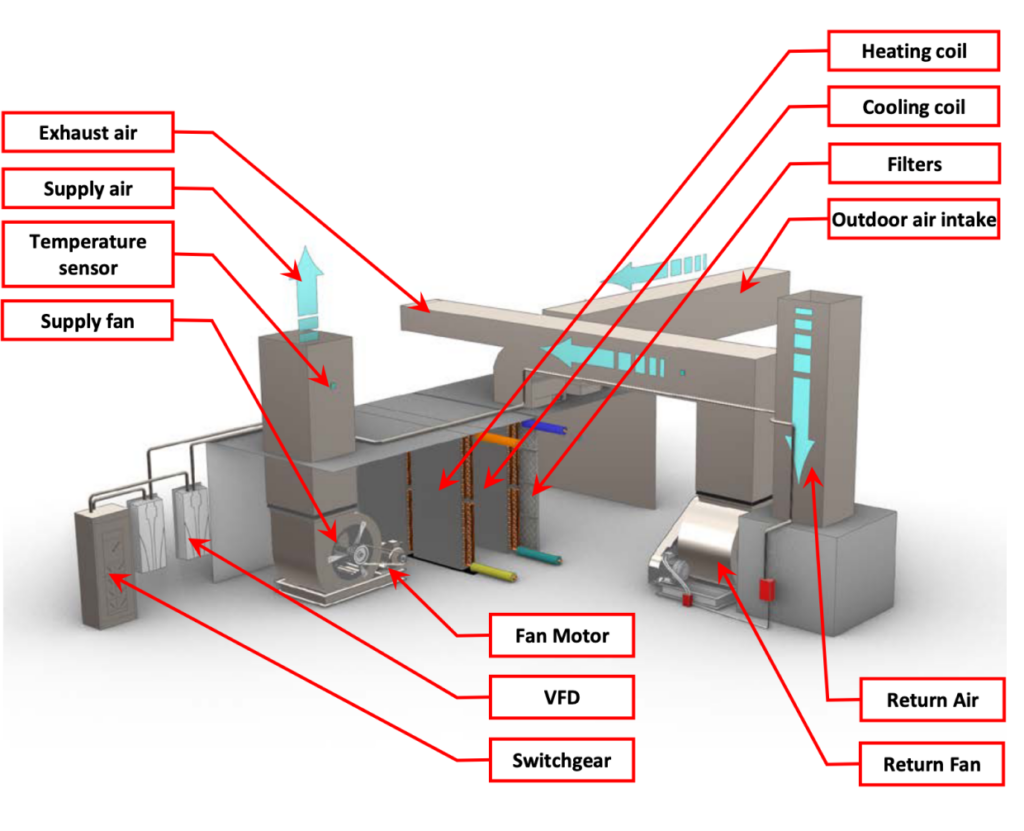
Various components of the AHU can be controlled to regulate operations and reduce energy consumption. For example, single-speed fan motors may be retrofitted with two-speed motors or VFDs, which save energy by slowing the flow rate during unoccupied periods; belt and pulley configurations can be changed to adjust air flow; coil valves may be fitted with controllers to optimize heat transfer as heating/cooling loads vary; and outdoor air dampers are commonly controlled to bring in cool outdoor air when conditions are right in lieu of conditioning spaces (i.e., economizing) and to manage ventilation rates.
Key Variables Associated with Calculating Energy Consumption of an AHU Fan Motor
The primary energy source for an AHU fan system is electricity, which is measured in kWh. The electric consumption of an AHU fan motor is a function of the operating hours and the fan speed, where the fan affinity laws define power as proportional to the cube of the fan speed. The relevant variables used to characterize the electricity consumption of AHU fans are:
- True RMS Power input to the VFD or motor for both supply and return fans
- Operating schedule
- OAT (if fan speed or operation is OAT-dependent)
While the power demand of the motor is affected by the AHU design, operating rules, and cooling/heating loads, the goal of this guide is simply to assess avoided energy use, and hence no other variables are needed beyond the three listed above. Three common operational modes are covered in this guide:
- The first mode assumes a relatively constant fan speed, when no VFD has been installed. Electricity consumption (kWh) is the product of power draw (kW) and operating time (hours). The primary measurements, taken over several weeks, confirm the power draw and operating schedule.
- The second mode assumes a two-speed motor or VFD has been installed and that it is operated at two speeds, high speed for occupied hours and low speed for unoccupied hours. In this case, measured data of hourly power draw is classified as either low-speed or high-speed power draw. The electricity consumption is then the high-speed power draw multiplied by the number of hours at high speed plus the low-speed power draw multiplied by the number of hours at low speed.
- The third operating mode is for a VAV system, where the AHU fan speed varies to maintain a uniform static pressure in the supply duct. In this case, this guide details how to create a regression using measurements of true RMS power and OAT to create a statistical model. The annual electrical consumption is then calculated as the true RMS power (kW) drawn by the fan motor at a given OAT multiplied by the hours of operation of the fan at that given OAT. While OAT is not the exact controlling variable for a VAV system, it is a reasonable proxy for most facilities, unless the cooling loads are overwhelmingly driven by internal gains or solar loads.
Operating Characteristics
AHUs manage air flow and temperature to meet heating, cooling, and ventilation demands. Air flow is typically constant, and the heating or cooling coils are opened or closed to meet a specified discharge air temperature. A two-speed motor or a VFD may be installed to allow for a reduction in air flow during unoccupied periods. In a VAV system, the AHU flow is modulated by a VFD on the fan motor based on the number of VAV boxes calling for air flow. Return fans are synchronized with supply fans to provide enough return pressure to maintain air flow through the AHU.
AHU systems are operated year-round, though operating rules differ between heating and cooling season. Ventilation requires a minimum air flow rate during occupied periods. If heating and cooling is not needed, the AHU could be shut down completely during unoccupied periods, provided the system has the capacity to re-establish desired indoor air temperatures after being turned off.
Scope of This Guide
The profile of energy consumption and savings associated with two types of ECMs can be characterized using this guide:
High-Efficiency Motor Upgrade – Replacing an existing motor with a premium efficiency motor can yield avoided energy use by increasing the useful work output per unit of electricity consumed.
VFD Installation – Because VFDs control the relative speed of the fan, avoided energy use can result from implementing variable speed controls on constant speed systems, depending on the type of motor and fan involved. VFDs can be installed for both the supply and return fans, though they must be compatible with the motor that is to be upgraded. Usually VFDs are operated to reduce the air flow rate during unoccupied periods. Two-speed motors can also be used to reduce air flow, but they need to be measured the same way as a fan motor with a VFD.
This document is designed to assist in gathering both pre- and post-retrofit data for the electricity consumption of AHU supply and return fans. As such, a primary goal is to describe the data that should be collected through measurements and the appropriate equipment to perform those measurements. Guidance is provided for measuring both constant and variable speed motors, specifically for modular AHUs; packaged AHUs and RTUs (rooftop units) are not covered. Interactive effects on whole-facility heating and cooling loads resulting from the upgrade of the AHU fan motors (i.e., potentially lower cooling loads and higher heating loads due to less standby heat loss from the motor) are, likewise, not covered in this guide.
It is assumed that the full speed air flow is the same for the pre- and post-retrofit conditions. This document does not provide guidance on measuring and quantifying the heating or cooling energy consumption associated with modifying air flow or varying the quantity of outdoor air between pre- and post-retrofit conditions.
While this guide does cover the installation of VFDs with a two-speed control algorithm and VFDs in VAV systems, it is not applicable under certain conditions. in many cases, a VFD or two-speed fan may be installed and programmed to operate with new operating modes. For example, a VFD is installed and programmed to operate existing dampers and actuators to also provide demand control ventilation or an economizer cycle. In these cases, the avoided energy use from the VFD must be disaggregated from the avoided energy use attributable to the change in operations. A separate guide has been developed for measuring the avoided energy use associated with demand control ventilation.
When a motor is replaced, other AHU maintenance issues are often undertaken, including coil cleaning, changing pulleys, or replacement of belts, all of which can impact total air flow. It is important to record these other operational changes and account for them as non-routine adjustments. This guide assumes that no operational or maintenance items are being implemented in conjunction with the motor replacement or installation of two-speed motors or VFDs.
Measurements
Measurement Approach
This guide is focused on characterizing the electricity savings associated with changes to fan motor efficiency, speed, and operating schedule. As such, the measurement boundary of the system, per this guide, is defined as the fan motor plus the associated VFD, if one is installed. Savings calculations based on changes in heating, cooling, economizing, or varying ventilation rates are not covered in this guide. Figure 2 and Figure 3 illustrate the measurement boundaries used within the confines of this guide.
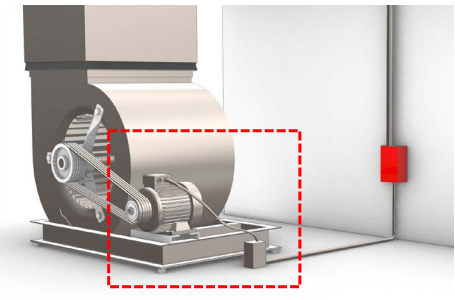
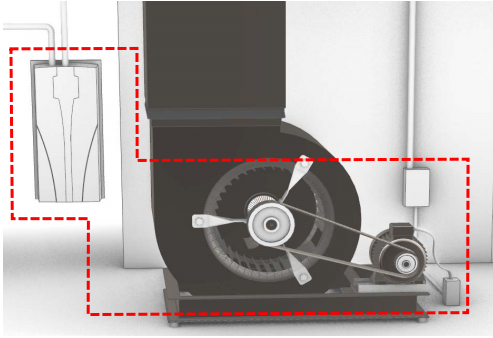
The measurement strategy for this system is determined by whether the fan is operated at a single speed or modulated with a VFD. Figure 4 illustrates a decision tree that can be used to identify which measurement strategy to apply to a specific system, based on its configuration and components.

Measure Motor On/Off Operation
This is generally the pre-retrofit condition for most air handlers, and the post-retrofit condition when only changing to a higher efficiency motor. The measurement approach assumes that the power draw stays constant throughout the measurement period. Because the motor is at constant speed, it is either running at full power (when turned on) or it is drawing no power (when turned off). As such, a motor on/off data logger is used to track the operating schedule.
For both the supply and return fans, the following parameters should be measured:
- True RMS electrical power of the motor that drives the fan (kW)
- Fan motor runtime
If it is not possible to determine whether the fan motor has a constant power draw (e.g., through physical observation of the system, an interview with the building operator, or review of as-built drawings) it is best to derive runtime and power by using the next measurement strategy.
Measure at the Main Feed to the VFD
When power draw is varied (i.e., modulating or running at multiple fixed fan speeds) the measurement approach is the same – a direct or proxy measurement of power is needed to characterize the range of operation and how it varies either with operational schedule or, in the case of VAV systems, with OAT. Because fan power is proportional to the cube of the fan speed, it is important to measure fan power over the full range of load conditions. Several weeks of measurements backed up by documentation showing the programming in the controller is generally sufficient for single- or multiple-speed fans. For modulating fans, at least four-to-six weeks during the hottest time of summer, the coldest time of winter, and a few weeks during spring or fall should be sufficient to capture the operation of the system with respect to OAT. If the system is designed to economize, it is important to include measurements during that mode if the speed changes during economizer cycles.
Sampling
If there are multiple units being upgraded in the building, it may be possible to sample them, provided they all have the same operating schedules. The following guidelines for sampling AHUs were developed by PNNL for the Building Re-tuning[2] protocol and are reasonable to apply to measurement of energy consumption:
- If there are fewer than six AHUs, then monitor all AHUs, otherwise measure about half of the AHUs.
- For tall buildings, measure at least one AHU per floor; for a particularly tall building, measure one AHU on every other floor.
- For buildings with occupied basements, include the basement AHU in the measurement plan.
If a more rigorous sampling plan is needed, Bonneville Power Administration[3] has developed an excellent resource for guidance.
Measurement Tools and Equipment
The measurements in this guide can be performed with the equipment listed in Table 1; more detailed descriptions have been provided in Table 2. NYC agency employees can borrow the recommended equipment from our website, and have it delivered to their facility. Third-party M&V consultants and others can use this equipment list as guidance, recognizing that many manufacturers make comparable equipment. Inclusion on the list in Table 1 or Table 2 should not be construed as an endorsement of these manufacturers.
| Measurement | Units | Tool | Equipment |
|---|---|---|---|
| True RMS Power | kW | Clamp Meter | Fluke 345 Power Quality Clamp Meter |
| Apparent Current | Amperes | Current Sensor and Data Logger | Onset HOBO Split-Core Current Sensor Onset HOBO 4-Channel Analog Data Logger (UX120-006M) |
| True RMS Energy | kWh | Data-logging Power Meter and Current Transformers | DENT ELITEproXC Portable Power Data Logger (EXCUNC) Dent 16” RoCoil Flexible Rope Current Transformers (CT-R16-A4-U) |
| Motor Runtime | Seconds / Hour | Motor On/Off Logger | Onset HOBO Motor On/Off Data Logger (UX90-004) |
| OAT | °F | Weatherproof Temperature/Relative Humidity Data Logger | Onset HOBO Temperature/Relative Humidity Weatherproof Data Logger (MX2301) |
| Equipment | Description |
|---|---|
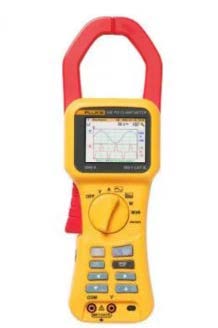 Fluke 345 Power Quality Clamp Meter | Multi-purpose electrical measurement tool used to take true RMS power readings over a short period of time. |
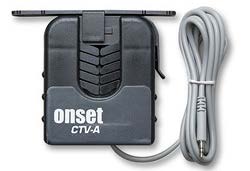 Onset HOBO Split-Core Current Sensor | Provides a measurement of the current flowing through a conductor and converts to a signal the U12- or UX120-series data logger can record. Rated for specific amperage ranges – CTV-A 2-20 amps, CTV-B 5-50 amp or CTV-C 10-100 amp). Sensor should be selected based on the maximum or minimum amperage anticipated to be measured, to avoid out of range readings. |
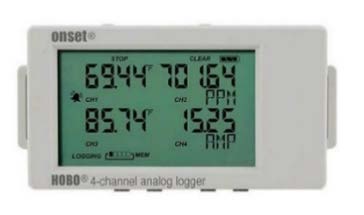 Onset HOBO 4-Channel Analog Data Logger (UX120-006M) | Used in conjunction with the CTV series of sensors. Records measurements from up to four CTV sensors. Requires HOBOware software and a USB connection cable for programming and downloading data files. |
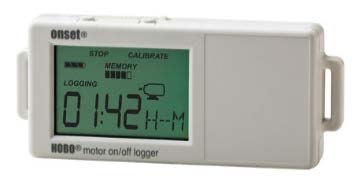 Onset HOBO Motor On/Off Data Logger (UX90-004) | Records when a motor is on and off, as well as runtime. Requires HOBOware software and a USB connection cable for programming and downloading data files. |
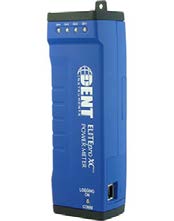 DENT ELITEproXC Portable Power Data Logger (EXCUNC) 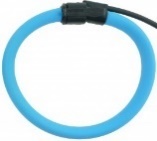 DENT 16” RoCoil Flexible Rope Current Transformers (CT-R16-A4-U) | Provides a measurement of true RMS power from voltage and current inputs and records long-term power (kW) and energy (kWh) measurements. Requires ELOG19 software and a USB connection cable for programming and downloading data files. |
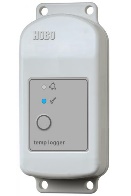 Onset HOBO Temperature/Relative Humidity Weatherproof Data Logger (MX2301) | Records outdoor air temperature and relative humidity using internal sensors. Requires HOBOware software and a USB connection cable for programming and downloading data files. |
Measurement Strategies
The following instructions have been developed for each measurement strategy discussed in this guide. While these are reasonably detailed, certain aspects of each strategy may need to be modified based on the specific system configuration at each facility. Early surveying of the facility is recommended when tailoring each strategy to unique site conditions.
The measurement recommendations reference supplementary equipment guides, which can be found in Appendix A.
A.1: Onset HOBO Motor On/Off Data Logger (UX90-004)
A.2: Fluke 345 Power Quality Clamp Meter
A.3: DENT ELITEproXC Portable Power Data Logger
A.4: Onset HOBO 4-Channel Analog Logger (UX120-006M) with Onset HOBO Split-Core Current Sensor
A.7: Onset HOBO Temperature/Relative Humidity Weatherproof Data Logger (MX2301)
Measure Motor On/Off Operation
This measurement approach is intended for constant speed, constant volume system configurations.
STEP 1: Preparation for Data Acquisition
- Confirm site conditions and locations where data acquisition equipment will be placed.
- Obtain measurement equipment from NYC Energy Tools:
- Onset HOBO Motor On/Off Data Logger (UX90-004)
- Fluke 345 Power Quality Clamp Meter
- Refer to A.1: Onset HOBO Motor On/Off Data Logger (UX-90-004)
- Set up and deploy data logger per the instructions in sections A.1.1 to A.1.3.
STEP 2: Installation at the Site
- Implement appropriate safety procedures.
- Refer to A.2: Fluke 345 Power Quality Clamp Meter
- Take a one-time measurement of true RMS power draw of the motor per the instructions in section A.2.1.
- Take a screenshot of the reading per the instructions in section A.2.2 (or, alternatively, a photograph using a cell phone).
- Refer to A.1: Onset HOBO Motor On/Off Data Logger (UX90-004)
- Install the motor on/off logger in the selected location and be sure the logger passes the ion with the motor running per the instructions in sections A.1.4 and A.1.5.
- Initial field setup is now complete.
STEP 3: Verify Data is Being Collected
- Implement appropriate safety procedures.
- If possible, wait for the first recording period to pass during the installation at site; if not, return to the site as soon as possible to retrieve data from the logger to verify data collection. Do not remove the logger from the equipment.
- Refer to Appendix A.1: Onset HOBO Motor On/Off Data Logger (UX90-004)
- Confirm that the logger is collecting data and that system operation is being recorded per the instructions in section A1.6. Be careful not to stop the logger when downloading data.
- It is recommended that this step be repeated periodically during the measurement period.
STEP 4: Retrieve Data Acquisition Equipment and Download Data
- Implement appropriate safety procedures.
- Refer to Appendix A.1: Onset HOBO Motor On/Off Data Logger (UX90-004)
- Confirm that the logger has collected the required operational data per the instructions in section A.1.6. Do not yet remove the logger from the equipment. Be careful not to stop the logger when downloading data.
- Once data acquisition has been confirmed, stop the logger per the instructions in section A.1.7.
- Remove the data logger and return to NYC Energy Tools.
Measure Power Consumed at Main Feed to Motor or VFD Using Data-logging Power Meter
This approach is the preferred method for a variable speed system (i.e., either two-speed or modulating with OAT), in which case a data-logging power meter (e.g., DENT ELITEproXC Portable Power Data Logger) is attached at the feed to the VFD. It can also be used for a constant speed, constant volume system configuration, in which case the measurement should be taken at the motor switch panel.
STEP 1: Preparation for Data Acquisition
- Confirm site conditions and locations where data acquisition equipment will be placed.
- For a single- or two-speed system:
- Obtain measurement equipment from NYC Energy Tools:
- DENT ELITEproXC Portable Power Data Logger – (EXCUNC) with 16” Flexible Current Transformers (CTs) (DENT CT-R16-A4-U)
- Obtain measurement equipment from NYC Energy Tools:
- Refer to Appendix A.3: DENT ELITEproXC Portable Power Data Logger
- Set up and initialize the DENT logger per the instructions in section A.3.1.
- For a continuously variable system with OAT:
- Obtain measurement equipment from NYC Energy Tools:
- DENT ELITEproXC Portable Power Data Logger– (EXCUNC) with 16” Flexible CTs (DENT CT-R16-A4-U)
- If the AHU varies air volume based on OAT, also use the Onset HOBO Temperature/Relative Humidity Weatherproof Data Logger (MX2301)
- Obtain measurement equipment from NYC Energy Tools:
- Refer to Appendix A.3: DENT ELITEproXC Portable Power Data Logger
- Set up and initialize the DENT logger per the instructions in sections A.3.1.
- Refer to Appendix A.7: Onset HOBO Temperature/Relative Humidity Weatherproof Data Logger (MX2301)
- Set up and initialize the Temperature/Relative Humidity Weatherproof Data Logger, per the instructions in sections A.7.1 through A.7.3.
STEP 2: Installation at the Site
- Implement appropriate safety procedures.
- For a single or two-speed system refer to Appendix A.3: DENT ELITEproXC Portable Power Data Logger
- Install the DENT ELITEproXC Portable Power Data Logger using sections A.3.2 to A.3.3 as guidance.
- For a continuously variable system with OAT refer to Appendix A.3: DENT ELITEproXC Portable Power Data Logger and Appendix A.7: Onset HOBO Temperature/Relative Humidity Weatherproof Logger (MX2301)
- Install the DENT ELITEproXC Portable Power Data Logger using sections A.3.2 to A.3.3 as guidance.
- Install the Temperature/Relative Humidity Weatherproof Data Logger using section A.7.4 as guidance.
- Initial field setup is now complete.
STEP 3: Verify Data is Being Collected
- Implement appropriate safety procedures.
- If possible, wait for the first recording period to pass during the installation at site; if not, return to the site as soon as possible to retrieve data from the logger to verify data collection. Do not remove the logger from the equipment.
- For a single or two-speed system refer to Appendix A.3: DENT ELITEproXC Portable Power Data Logger
- Confirm that the DENT ELITEproXC Portable Power Data Logger is collecting data and that system operation is being recorded per the instructions in section A.3.4. Be careful not to stop the meter when downloading data.
- For a continuously variable system with OAT refer to Appendix A.3: DENT ELITEproXC Portable Power Data Logger and Appendix A.7: Onset HOBO Temperature/Relative Humidity Weatherproof Logger (MXX2301)
- Confirm that the DENT ELITEproXC Portable Power Data Logger and Onset HOBO Temperature/Relative Humidity Weatherproof Data Logger (MX2301) are collecting data and that system operation is being recorded per the instructions in sections A.3.4 and A.7.5, respectively. Be careful not to stop the loggers when downloading data.
- It is recommended that this step be repeated periodically during the measurement period.
STEP 4: Retrieve Data Acquisition Equipment and Download Data
- Implement appropriate safety procedures.
- For a single or two-speed system refer to Appendix A.3: DENT ELITEproXC Portable Power Data Logger
- Confirm that the DENT ELITEproXC Portable Power Data Logger has collected the required data per the instructions in section A.3.4. Do not yet remove the meter from the equipment. Be careful not to stop the meter when downloading data.
- Once data acquisition has been confirmed, stop the logger per the instructions in section A.3.5.
- For a continuously variable system with OAT refer to Appendix A.3: DENT ELITEproXC Portable Power Data Logger and Appendix A.7: Onset HOBO Temperature/Relative Humidity Weatherproof Logger (MX2301)
- Confirm that the DENT ELITEproXC Portable Power Data Logger and Temperature/Relative Humidity Weatherproof Data Logger have both collected the required data per the instructions in sections A.3.4 and A.7.5, respectively. Do not yet remove the loggers from the equipment. Be careful not to stop the loggers when downloading data.
- Once data acquisition has been confirmed, stop the loggers per the instructions in section A.3.5 and A.7.6, respectively.
- Remove the data logger and return to NYC Energy Tools.
Measure Current Supplied to Motor at Main Feed to VFD Using Current Sensor
This measurement approach is intended as an alternative method for a two-speed VFD system. It can also be used for a constant speed, constant volume system configuration where the measurement is taken at the switchgear instead of at the VFD.
If the DENT ELITEproXC Portable Power Data Logger (or equivalent) is not available or cannot be installed due to space or other constraints, an alternative is to:
- Ask the facility representative to set the motor to run at the low speed setting. Take one-time true RMS power, voltage, apparent current and power factor measurements with a Fluke 345 Power Quality Clamp Meter (or equivalent). Repeat at the high speed setting.
- Record the long-term apparent current being drawn by the motor with a current sensor and analog data logger on one or all of the conductors that serve the motor.
STEP 1: Preparation for Data Acquisition
- Confirm site conditions and locations where data acquisition equipment will be placed.
- Obtain measurement equipment from NYC Energy Tools:
- Fluke 345 Power Quality Clamp Meter
- Onset HOBO 4-Channel Analog Logger (UX120-006M)
- Onset HOBO Split-Core Current Sensor
- Refer to Appendix A.4 Onset HOBO 4-Channel Analog Logger (UX120-006M) with Onset HOBO Split-Core Current Sensor
- Set up and deploy data logger per the instructions in sections A.4.1 to A.4.3.
STEP 2: Installation at the Site
- Implement appropriate safety procedures.
- Refer to Appendix A.4 Onset HOBO 4-Channel Analog Logger (UX120-006M) with Onset HOBO Split-Core Current Sensor
- Install the current sensors and analog logger using section A.4.4 as guidance.
- Working with the appropriate facility personnel, measure the VFD when set to both low and high speeds.
- For each speed of the VFD, refer to Appendix A.2: Fluke 345 Power Quality Clamp Meter
- Take a one-time measurement of true RMS power draw of the motor, apparent current, power factor, and voltage per the instructions in section A.2.1.
- Take a screenshot of the reading per the instructions in section A.2.2 (or, alternatively, a photograph using a cell phone).
- If the fan is constant speed and constant volume, only one true power reading is needed.
- For each speed of the VFD, refer to Appendix A.2: Fluke 345 Power Quality Clamp Meter
- Initial field setup is now complete.
STEP 3: Verify Data is Being Collected
- Implement appropriate safety procedures.
- If possible, wait for the first recording period to pass during the installation at site; if not, return to the site as soon as possible to retrieve data from the logger to verify data collection. Do not remove the logger from the equipment.
- Refer to Appendix A.4 Onset HOBO 4-Channel Analog Logger (UX0-006M) with Onset HOBO Split-Core Current Sensor
- Confirm that the logger is collecting data and that system operation is being recorded per the instructions in section A.4.5. Be careful not to stop the logger when downloading data.
- It is recommended that this step be repeated periodically during the measurement period.
STEP 4: Retrieve Data Acquisition Equipment and Download Data
- Implement appropriate safety procedures.
- Refer to Appendix A.4 Onset HOBO 4-Channel Analog Logger (UX120-006M) with Onset HOBO Split-Core Current Sensor
- Confirm that the logger has collected the required operational data per the instructions in section A.4.5. Do not yet remove the logger from the equipment. Be careful not to stop the logger when downloading data.
- Once data acquisition has been confirmed, stop the logger per the instructions in section A.4.6.
- Remove the data logger and return to NYC Energy Tools.
Alternate Strategy: Download Data Directly from a BAS or VFD
This measurement approach is intended to be used for a two-speed VFD system that is controlled by a BAS or by a VFD with data-trending and exporting capability.
STEP 1: Preparation for Data Acquisition
- Confirm that the system can record either motor speed (in RPM) or percentage of full speed (in percentage). If possible, also record true RMS power. In lieu of true RMS power, current, voltage, and power factor may still be available. In this case, true RMS power can be calculated.
- Work with the installer to program the VFD to record hourly average RPM or percent of full speed, as well was true RMS power (where possible).
- If the system cannot record true RMS power, obtain the following from NYC Energy Tools:
- Fluke 345 Power Quality Clamp Meter
STEP 2: Installation at the Site
- Note that, for this measurement approach, installation at the site will only be required if the system cannot record true RMS power.
- Implement appropriate safety procedures.
- Working with the appropriate facility personnel, ramp the VFD to various speeds at which the VFD is programmed to operate.
- For each speed of the VFD, refer to Appendix A.2: Fluke Power Quality 345 Clamp Meter
- Take a one-time measurement of true RMS power draw of the motor, apparent current, power factor, and voltage per the instructions in section A.2.1.
- Take a screenshot of the reading per the instructions in section A.2.2. (or, alternatively, a photograph using a cell phone).
- For each speed of the VFD, refer to Appendix A.2: Fluke Power Quality 345 Clamp Meter
- Initial field setup is now complete.
STEP 3: Verify Data is Being Collected
- Implement appropriate safety procedures.
- If possible, wait for the first recording period to pass during the installation at site; if not, return to the site as soon as possible to retrieve data from the system. Do not stop the data recording process when downloading the data.
- Confirm that the data is being collected in the proper format, as required by the calculation spreadsheet.
- It is recommended that this step be repeated periodically during the measurement period.
STEP 4: Retrieve Data Acquisition Equipment and Download Data
- Implement appropriate safety procedures.
- Download data from the system for the duration of the measurement period.
- Make sure the data is formatted appropriately for the calculation spreadsheet.
Calculation Methodology
General
The measurement strategies and calculations in this guide have been derived from several sources, including:
- ASHRAE Guideline 14: Measurement of Energy, Demand, and Water Savings[4]
- US Department of Energy’s Uniform Methods Project[5]
- Bonneville Power Authority’s Implementation Manual Document Library[6]
- EVO IPMVP Application Guides Family[7]
To adhere to the fundamental concepts discussed in this guide (appropriate, necessary, reasonable, replicable, consistent, simple, and purpose-driven) these strategies have been generalized to enable the broadest use possible. It should be noted that there are many situations where these strategies and the associated calculations will need to be modified to suit individual facilities or specific system configurations. Consult the above sources for additional detail and guidance on extrapolating these general guidelines to suit your specific situation.
As stated earlier, fan energy consumption is a function of power and time. The measurement strategies presented in this guide, and their associated spreadsheets, enable the measurement of fan power consumption and fan load frequency distribution. These load frequencies are referred to as “operational bins” in that they can be grouped like periods of operation and the power draw associated with that bin. A constant speed AHU fan is considered to have only one operational bin – that being “on.” A two-speed fan has two operational bins (low speed and high speed), and a variable speed fan will have multiple operational bins that are based on the controlling variable. In this guide, OAT is used as the operational bin variable. Total annual energy (in kWh) is calculated using the general equation, taken from ASHRAE Guideline 14:
E\left[\frac{kWh}{year}\right]=\sum_{i}T_i [Hours] * P_i[kW]where,
E = electricity use of AHU fan motor in kW/year
i = bin index, or operational bin, as defined by load frequency distribution
Ti = total time that AHU is in each operational bin, in hours/year (note that operational bin can be defined by temperature ranges or scheduling characteristics)
Pi = average motor power draw for each operational bin, in kW
Five Microsoft Excel workbooks have been developed along with this guide to facilitate the calculation of total annual energy consumption from the measured data:
- Constant speed, constant volume fans using a motor on/off logger – This workbook calculates annual consumption of supply and return fans using spot measurements for true power and motor operational time per hour, as measured by motor on/off data loggers.
- Constant speed or two-speed, constant volume fans using data logging power meter – This workbook calculates annual consumption using average hourly power draw in kW.
- Two-speed VFD-controlled fans using current sensors – This workbook calculates annual consumption using hourly average current (in Amps) as directly measured by current sensors, and spot measurements for true power at both high and low speed operation.
- Two speed VFD-controlled fans using speed data from BAS or VFD– This workbook calculates annual consumption using hourly average motor speed (in RPM), as downloaded from a BAS or a VFD, and spot measurements for true power at both high and low speeds.
- Variable speed, variable volume fans using data logging power meter and weatherproof temperature/relative humidity data logger – This worksheet calculates annual consumption using the average hourly power draw (kW) and the average hourly OAT.
Instructions are included in each workbook that detail how to input data and how to interpret and make use of the results. Specific calculation methodologies can be found in Appendix A.13: AHU Fan Calculations and are captured in the workbooks. Click on the workbook name to download.
Reporting Recommendations
As part of the documentation of expected avoided energy use, the integration of measurements and calculation methodology discussed in this guide will serve to enhance these projections. To facilitate transparency and data quality control, the following pieces of information should be documented to accompany expected savings calculations:
- Measurement tool information and dates of measurement. The HOBOware software records logger information (such as product, serial number, and version number) as well as deployment and measurement dates. To export this information, use the software to open the logger data file, then select “Export Details” from the File menu; this will produce a text file like the one shown in Figure 5. Repeat for all data loggers that were deployed and include all files with the funding application.

- If a BAS was used to collect any of the information discussed in this guide, submit a brief description of the system, including:
- BAS manufacturer and model
- BAS software and version number
- Measurement dates
- Most recent date of sensor calibration (if a sensor was used)
- The completed workbook(s) containing measured data.
It is expected that the user will be responsible for measuring the system of interest and compiling the data input to the calculation tools. The output of these tools can be directly used to satisfy reporting requirements.