Lighting Measurement Guide: Mixed Panelboard with Automatic Controls
Published: June 24, 2020
By: Orlando Castillo | Jr. Analyst | Interns, Duncan Prahl, RA, AIA | Sr. Applied Research Scientist
Reviewed by: Jillian Panagakos | Jr. Engineer, Honey Berk, LEED AP O&M,CMVP | Managing Director
Helpful Resources
Download this Guide
DownloadGeneral System Overview
This guide describes the measurement approach for quantifying avoided energy use associated with retrofitting lighting systems with automatic controls, which are on panelboards that serve lighting loads other electrical loads (e.g., receptacles, equipment, etc.). The system may either have integrated control (ITC) at the panelboard or distributed control (DTC), where controls replace manual wall switches in the occupied space and are frequently coupled with wireless occupancy sensors.
Safety
This guide does not cover health and safety aspects of the collection of measurements at facilities. There are many hazards that exist in facilities surrounding the collection of measurements, including but not limited to: electrical safety, fall protection, personal protective equipment, control of hazardous energy (lock out/ tag out), confined space, respiratory protection, and machine safeguarding. Part of the measurement planning process must include the identification and mitigation of these and other hazards. The implementation of a measurement strategy and installation of measurement equipment should be performed by qualified personnel.
Description of System
The following sections provide background information on the components of lighting systems with automatic controls. If you are already familiar with the system, you may skip to the Measurement Description for System section.
System Overview
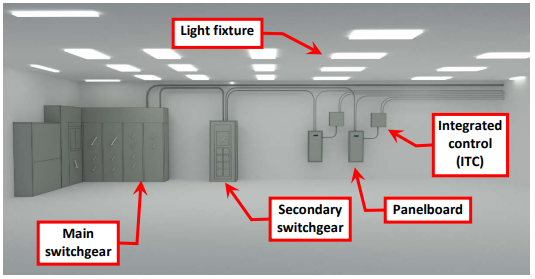
A general lighting system, as shown in Figure 1, comprises a main electrical switchgear, possibly a secondary switchgear, a panelboard with circuit breakers that serves multiple circuits, the light fixtures and may include manual controls (i.e., light switches) or automatic controls (occupancy, timer or light level controls) in each space on each circuit.
For the purposes of measuring lighting system energy consumption, lighting systems have been divided into four general categories. Because the components for the system and evaluation process vary for each system which impacts the measurement techniques, separate guides were developed, as follows:
- Lighting on panelboards that serve only lighting loads without an automatic control system (Lighting on Dedicated Panelboard without Automatic Controls)
- Lighting on panelboards that serve only lighting loads with an automatic control system (Lighting on Dedicated Panelboard with Automatic Controls)
- Lighting on panelboards that serve lighting and other loads (e.g., receptacles, office equipment, etc.) without an automatic control system (Lighting on Mixed Panelboard without Automatic Controls)
- Lighting on panelboards that serve lighting and other loads (e.g., receptacles, office equipment, etc.) with an automatic control system (Lighting on Mixed Panelboard with Automatic Controls)
Interior lighting affects both heating and cooling system energy consumption because waste heat generated by lights increases the cooling load and reduces the heating load. A more efficient lighting system will reduce cooling energy consumption and increase heating energy consumption because less waste heat is put into the space. Measurement of the change in heating and cooling loads associated with a lighting retrofit are not discussed in this guide.
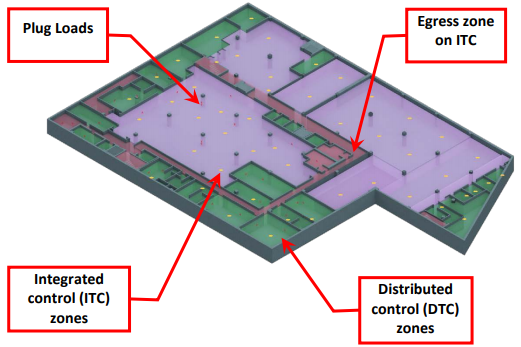
This document was designed to provide guidance for measuring lighting on panelboards that serve only lighting loads with an automatic control system as illustrated in Figure 2.
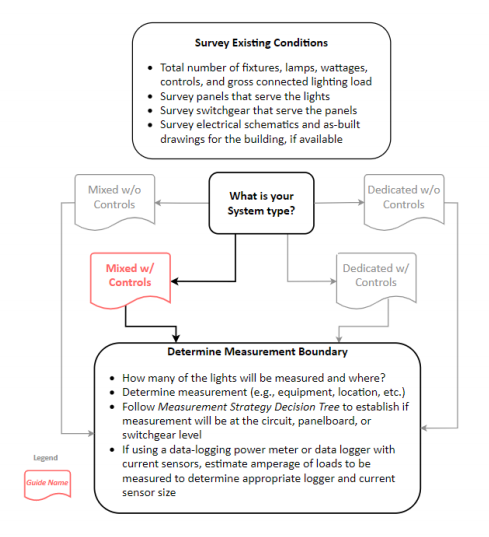
The flowchart in Figure 3 should be used to determine which system is present in your facility and, as a result, which measurement guide and process flow to use.
This document does not provide guidance on measuring and quantifying the interactive effects of heating or cooling energy consumption associated with replacing inefficient lamps or ballasts. The calculation tools that accompany this guide generate an estimate of average hourly kWh for lighting for each day of the week. This can be used to calculate interactive effects separately, based on occupancy, season, percentage of lighting waste heat attributed to spaces, and heating and cooling system efficiencies.
Key Variables Associated with Calculating Energy Consumption of an AHU Fan Motor
The energy source for a lighting system is electricity, which is measured in kWh. The relevant variables used to characterize the electricity consumption of a lighting system are:
- Hours of operation
- Total connected load in kW, which is a function of:
- Number of fixtures
- Wattage per fixture
Operating Characteristics
Lighting is solely needed when spaces are occupied to provide adequate illumination for the tasks being performed. The Illuminating Engineering Society has developed task-based recommendations for lighting levels and it is the designer’s responsibility to select fixtures, lamps and fixture locations to appropriately to meet these light levels.
A lighting system on a panel with other loads is typically found on 120V panels, where it is relatively easy to incorporate receptacles that serve other loads. In some cases, higher voltage 227V/480V panels with lighting can have other loads but it is more uncommon. The control system can have a variety of operating characteristics and levels of functionality. These include, but are not limited to, lighting operation by time, by occupancy or vacancy, emergency or night-lighting functions, and the ability for occupants to manually override the control system. This is discussed in greater detail in the Occupancy Characterization section below.
Scope of This Guide
The profile of energy consumption and savings associated with the following ECMs can be characterized using this guide:
- Installation of an automatic control system, which may or may not also include:
- Replacement of low-efficiency lamps and ballasts in existing fixtures
- Wholesale replacement of fixtures (including lamps and ballasts)
This document is designed to assist in gathering either pre- or post-retrofit data for the electricity consumption of a lighting system. As such, a primary goal is to describe the data that should be collected through measurements and the appropriate equipment to perform those measurements. Guidance is provided for specifically measuring lighting systems connected to dedicated panelboards with automatic controls. The other systems outlined earlier (including systems connected to mixed lighting panelboards or without automatic controls) are not covered in this guide.
Because of the many permutations that exist with automatic control systems, a number of decisions need to be made as part of the system characterization undertaken during the initial site survey mentioned in Figure 3. It is also important to evaluate pre- and post-retrofit measurements to determine if routine or non-routine events took place that need to be accounted for in the calculations. Routine events include holidays or vacation weeks that may occur during the measurement period; nonroutine events include unscheduled shutdowns or emergency 24-hour operations.
Measurements
Measurement Approach
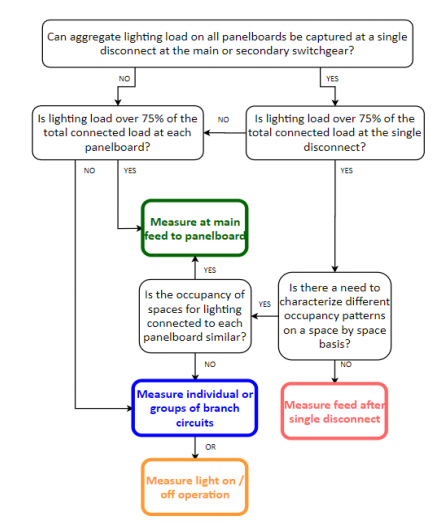
The measurement boundary[1] of a lighting system on a dedicated panel with automatic controls will differ based on the configuration of the lighting system in the specific facility. Figure 4 illustrates a decision tree that can be used to identify the measurement boundary and general approach that should be used for the system being assessed.
Occupancy Characterization
A major consideration when measuring a lighting system with automatic controls is the level to which characterization of occupancy patterns is needed. Generally, measurement at a panel or switchgear level is likely adequate to simply estimate the avoided energy between pre-and-post retrofit periods. If the purpose of conducting measurements is to gain an understanding of pre-retrofit occupancy patterns in a specific facility to better estimate savings, measurement at the panel, circuit, or space is likely more appropriate. Another factor to consider is the scale of the retrofit and the occupancy variation in the spaces where the retrofit is taking place. Measurement at the switchgear or panel level in a large single use facility with small percentage of office space, like a warehouse, is probably appropriate. When measuring a large facility with a mix of spaces and uses (e.g., school, courthouse, fire station) it may be desirable to measure at the panel, circuit, or space level, especially if a sampling plan is being implemented (see Sampling section below). Detailed measurements may also be desirable in a small set of buildings with similar use types (e.g., fire or police stations, schools, etc.), to develop standardized occupancy schedules for different space types that can then be used to estimate savings in a larger population of buildings, in conjunction with switchgear- or panel-level measurements.
Another consideration is the degree to which the lighting controls are integrated with the building automation system (BAS) or can log the operation of different circuits or spaces. The Internet of Things (IoT) has ushered in a vast number of control capabilities, including fixtures within a space that can be individually controlled by an occupant using a smartphone app. This level of control is beyond the scope of this guide, but many mainstream LED fixtures now offer IP-based connectivity.
Evaluating the data-capturing capabilities of the control system is an important aspect of the functional requirements for the design team or implementation contractor. The incremental cost of integrating data-logging capabilities in some systems is nominal or may simply be a function that is built in but needs to be activated during commissioning. Some systems will internally measure and record energy consumption in real time. Some control system can record on/off states and when coupled with a simple circuit-by-circuit one-time measurement of power draw using a clamp meter, reflects a relatively simple measurement approach.
Ultimately, a mixed approach may be needed: spaces in the building with intermittent occupancy may require detailed measurements; while, spaces where lighting is provided regardless of occupancy can use measurements at the panel or switchgear. Pacific Northwest National Lab[2] (PNNL) recommends that at least 75% of the total lighting load be measured to reasonably capture the operational characteristics of the facility.
Sampling
Lighting hours may vary seasonally depending on the amount of daylight available to the spaces being illuminated. Small spaces such as conference rooms or private offices may operate with inconsistent schedules. To establish the best estimate of avoided energy use, measurements should be taken for as much of the lighting to be replaced as possible, to capture both the energy consumption and the occupancy patterns. If only a sample of fixtures can be measured, the sample should be chosen carefully to reasonably represent all of the operational conditions and fixture types included in the upgrade, not simply the highest wattage fixtures or those with the largest number of operating hours. If a more rigorous sampling plan is needed, Bonneville Power Administration[3] has developed an excellent resource for guidance.
Measurement Boundaries and Types
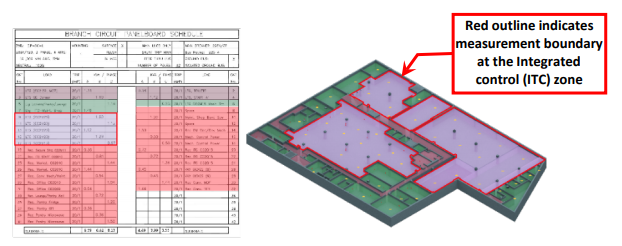
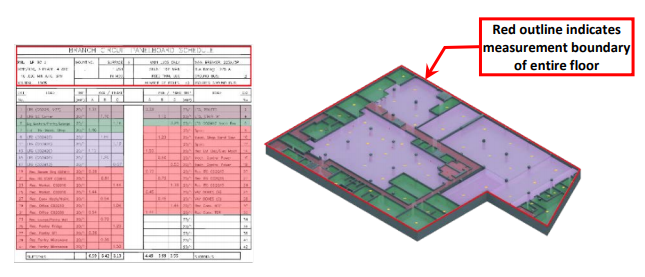
Two examples of possible measurement boundaries for lighting on a mixed panelboard with automatic controls and differing occupancy characteristics are shown in Figures 5 and Figure 6.
Measure Feed After Single Disconnect
This strategy, represented in Figure 7, is appropriate when multiple panelboards are served from a single piece of switchgear and the main feed to those panelboards can be de-energized to install measurement equipment. True RMS power and operating hours can be captured using the same equipment that would be used to measure at the main feed.
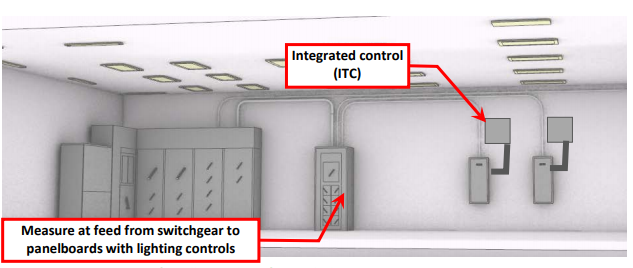
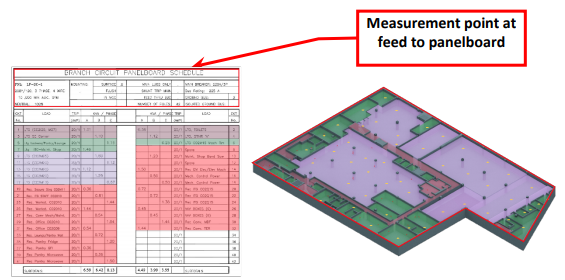
Measure at Main Feed to Panelboard
This strategy, represented in Figure 8, is usually the easiest measurement to take, though it typically requires de-energizing the panelboard at the associated switchgear. True RMS power can be measured using a data-logging power meter, or a one-time reading using a clamp meter can be used with a long-term measurement of apparent AC current that is then correlated to true RMS power.
Measure Individual or Groups of Branch Circuits
This strategy, represented in Figure 9, is most appropriately used to evaluate the lighting operation where the circuits serve more than 75% of the lighting in the space(s) of interest. True RMS power and operating hours can be captured using the same equipment that would be used to measure at the main feed, and occupancy patterns can be developed based on the hourly energy consumption.

Measure Light On/Off Operation
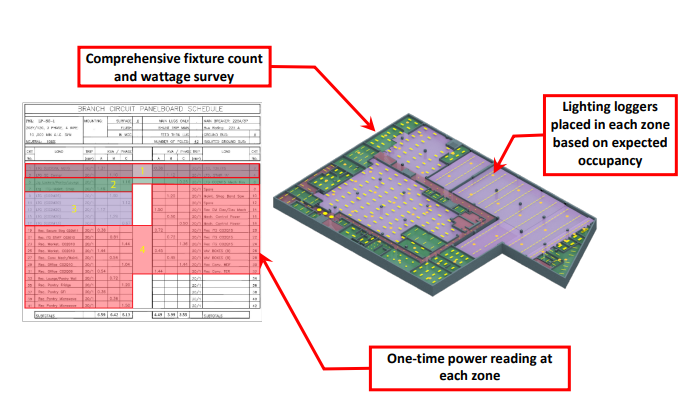
This strategy, represented in Figure 10, may be used where measurement of detailed occupancy patterns in highly localized spaces is desired, such as when characterizing lighting use by space type to apply to a sampling plan. However, a thorough fixture inventory is required to reasonably develop estimates of avoided energy. This strategy may also be helpful in improving predictions of post-retrofit lighting operation and in confirming sensor locations prior to design of an automatic control system. The hours of operation are measured with light on/off data loggers, which should be placed in close proximity to the fixture types that are expected to constitute over 75% of the total connected load in kW.
Measurement Tools and Equipment
The measurements in this guide can be performed with the equipment listed in Table 1; more detailed descriptions have been provided in Table 2. NYC agency employees can borrow the recommended equipment from NYC Energy Tools, and have it delivered to their facility. Third-party M&V consultants and others can use this equipment list as guidance, recognizing that many manufacturers make comparable equipment. Inclusion on the list in Table 1 or Table 2 should not be construed as an endorsement of these manufacturers.
| Measurement | Units | Tool | Equipment |
|---|---|---|---|
| True RMS Power | kW | Clamp Meter | Fluke 345 Power Quality Clamp Meter |
| Apparent Current | Amperes | Current Sensor and Data Logger | Onset HOBO Split-Core Current Sensor Onset HOBO 4-Channel Analog Data Logger (UX120-006M) |
| True RMS Energy | kWh | Data-logging Power Meter and Current Transformers | DENT ELITEproXC Portable Power Data Logger (EXCUNC) Dent 16” RoCoil Flexible Rope Current Transformers (CT-R16-A4-U) |
| Hours of Operation | Seconds | Light Data Logger | Onset HOBO Light On/Off Data Logger (UX90-002) |
| Equipment | Description |
|---|---|
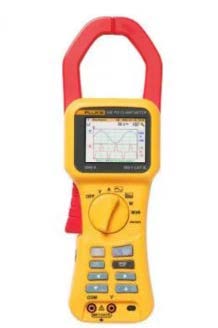 Fluke 345 Power Quality Clamp Meter | Multi-purpose electrical measurement tool used to take true RMS power readings over a short period of time. |
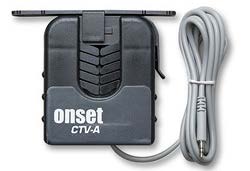 Onset HOBO Split-Core Current Sensor | Provides a measurement of the current flowing through a conductor and converts to a signal the U12- or UX120-series data logger can record. Rated for specific amperage ranges – CTV-A 2-20 amps, CTV-B 5-50 amp or CTV-C 10-100 amp). Sensor should be selected based on the maximum or minimum amperage anticipated to be measured, to avoid out of range readings. |
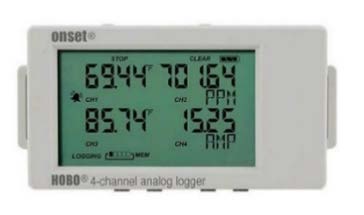 Onset HOBO 4-Channel Analog Data Logger (UX120-006M) | Used in conjunction with the CTV series of sensors. Records measurements from up to four CTV sensors. Requires HOBOware software and a USB connection cable for programming and downloading data files. |
 Onset HOBO Light On/Off Data Logger (UX90-002) | Records light on/off conditions using an internal sensor. Requires HOBOware software and a USB connection cable for programming and downloading data files. |
 DENT ELITEproXC Portable Power Data Logger (EXCUNC)  DENT 16” RoCoil Flexible Rope Current Transformers (CT-R16-A4-U) | Provides a measurement of true RMS power from voltage and current inputs and records long-term power (kW) and energy (kWh) measurements. Requires ELOG19 software and a USB connection cable for programming and downloading data files. |
Measurement Strategies
The following instructions have been developed for each measurement strategy discussed in this guide. While these instructions are reasonably detailed, certain aspects of each strategy may need to be modified based on the specific system configuration at each facility. Early surveying of the facility is recommended when tailoring each strategy to unique site conditions.
The measurement recommendations reference supplementary equipment guides, which can be found in Appendix A.
A.2: Fluke 345 Power Quality Clamp Meter
A.3: DENT ELITEproXC Portable Power Data Logger
A.4: Onset HOBO 4-Channel Analog Logger (UX120-006M) with Onset HOBO Split-Core Current Sensor
A.5: Onset HOBO Light On/Off Data Logger (UX90-002)
Measure Feed After Single Disconnect OR Measure at Main Feed to Panelboard Using Data-logging Power Meter
STEP 1: Preparation for Data Acquisition
- Confirm site conditions and locations where data acquisition equipment will be placed.
- Obtain measurement equipment from NYC Energy Tools:
- DENT ELITEpro XC Power Meter – (EXUNC)
- 16” Flexible Current Transducers (CTs) (DENT CT-R16-A4-U)
- Refer to A.3: DENT ELITEpro XC Power Meter
- Set up and initialize the DENT logger per the instructions in section A.3.1.
STEP 2: Installation at the Site
- Implement appropriate safety procedures.
- Refer to Appendix A.3: DENT ELITEpro XC Power Meter
- Install the ELITEpro XC power meter and CTs at the main feed lines of the panelboard per the instructions in sections A.3.2 to A.3.3.
- Initial field setup is now complete
STEP 3: Verify Data is Being Collected
- Implement appropriate safety procedures.
- If possible, wait for the first recording period to pass during the installation at site; if not, return to the site as soon as possible to retrieve data from the logger to verify data collection. Do not remove the logger from the equipment.
- Refer to Appendix A.3: DENT ELITEpro XC Power Meter
- Confirm that the logger is collecting data and that system operation is being recorded per the instructions in section A.3.5. Be careful not to stop the logger when downloading data.
- It is recommended that this step be repeated periodically during the measurement period.
STEP 4: Retrieve Data Acquisition Equipment and Download Data
- Implement appropriate safety procedures.
- Refer to Appendix A.3: DENT ELITEpro XC Power Meter
- Confirm that the logger has collected the required operational data per the instructions in section A.3.5. Do not yet remove the logger from the equipment. Be careful not to stop the logger when downloading data.
- Once data acquisition has been confirmed, stop the logger per the instructions in section A.3.5.
- Remove the data logger and return to NYC Energy Tools.
Measure Feed After Single Disconnect OR Measure at Main Feed to Panelboard Using Clamp Meter, Current Sensors, and an Analog Data Logger
This approach should be used as an alternate method to measuring after a single disconnect or main feed with a data-logging power meter if the DENT ELITEpro XC Portable Power Data Logger (or equivalent) is not available or cannot be installed due to space or other constraints.
STEP 1: Preparation for Data Acquisition
- Confirm site conditions and locations where data acquisition equipment will be placed.
- Obtain measurement equipment from NYC Energy Tools:
- Fluke 345 Power Quality Clamp Meter (Fluke 345)
- Onset 4-Channel Analog Logger (UX120-006M)
- Onset Amp Split Core AC Current Sensors (CTV-A, B, or C)
- Refer to Appendix A.4 Onset HOBO 4-Channel Analog Logger (UX120-006M) & Onset Split Core AC Current Sensor
- Set up and deploy data logger per the instructions in sections A.4.1 to A.4.3.
STEP 2: Installation at the Site
- Implement appropriate safety procedures.
- Refer to A.2: Fluke 345 Clamp Meter
- Take a one-time measurement of true RMS power draw at the main feed lines of the panelboard per the instructions in section A.2.1
- Take a screenshot of the reading per the instructions in section A.2.2 (or, alternatively, a photograph using a cell phone).
- Refer to Appendix A.4 Onset HOBO 4-Channel Analog Logger (UX120-006M) & Onset Split Core AC Current Sensor
- Install the current sensors and analog logger using section A.4.4 as guidance.
- Initial field setup is now complete.
STEP 3: Verify Data is Being Collected
- Implement appropriate safety procedures.
- If possible, wait for the first recording period to pass during the installation at site; if not, return to the site as soon as possible to retrieve data from the logger to verify data collection. Do not remove the logger from the equipment.
- Refer to Appendix A.4 Onset HOBO 4-Channel Analog Logger (UX120-006M) & Onset Split Core AC Current Sensor
- Confirm that the logger is collecting data and that system operation is being recorded per the instructions in section A.4.5. Be careful not to stop the meter when downloading data.
- It is recommended that this step be repeated periodically during the measurement period.
STEP 4: Retrieve Data Acquisition Equipment and Download Data
- Implement appropriate safety procedures.
- Refer to Appendix A.4 Onset HOBO 4-Channel Analog Logger (UX120-006M) & Onset Split Core AC Current Sensor
- Confirm that the logger has collected the required operational data per the instructions in section A.4.5. Do not yet remove the logger from the equipment. Be careful not to stop the logger when downloading data.
- Once data acquisition has been confirmed, stop the logger per the instructions in section A.4.6.
- Remove the data logger and return to NYC Energy Tools.
Measure Individual or Groups of Branch Circuits Using Clamp Meter, Current Sensors, and an Analog Data Logger
This approach should be used when measuring a main feed is not feasible, and individual circuits or groups of circuits can be measured using up to four current sensors to capture the lighting load in the panel. This measurement is similar to the above description, however an assessment of the loads on each circuit or group of circuits may require the use and configuration of different current sensors.
STEP 1: Preparation for Data Acquisition
- Confirm site conditions and locations where data acquisition equipment will be placed.
- Obtain measurement equipment from NYC Energy Tools:
- Fluke 345 Power Quality Clamp Meter (Fluke 345)
- Onset HOBO 4-Channel Analog Logger (UX120-006M)
- Onset HOBO Split-Core Current Sensor (CTV-A, B, or C)
- Refer to Appendix A.4 Onset HOBO 4-Channel Analog Logger (UX120-006M) & Onset HOBO Split-Core Current Sensor
- Set up and deploy data logger per the instructions in sections A.4.1 to A.4.3.
STEP 2: Installation at the Site
- Implement appropriate safety procedures.
- Refer to A.2: Fluke 345 Clamp Meter
- Take a one-time measurement of true RMS power draw at the main feed lines of the panelboard per the instructions in section A.2.1
- Take a screenshot of the reading per the instructions in section A.2.2 (or, alternatively, a photograph using a cell phone).
- Refer to Appendix A.4 Onset HOBO 4-Channel Analog Logger (UX120-006M) & Onset Split Core AC Current Sensor
- Install the current sensors and analog logger using section A.4.4 as guidance. Verify that the appropriate sensor is being used based on the different range of amperage being measured.
- Initial field setup is now complete.
STEP 3: Verify Data is Being Collected
- Implement appropriate safety procedures.
- If possible, wait for the first recording period to pass during the installation at site; if not, return to the site as soon as possible to retrieve data from the logger to verify data collection. Do not remove the logger from the equipment.
- Refer to Appendix A.4 Onset HOBO 4-Channel Analog Logger (UX0-006M) with Onset HOBO Split-Core Current Sensor
- Confirm that the logger is collecting data and that system operation is being recorded per the instructions in section A.4.5. Be careful not to stop the logger when downloading data.
- It is recommended that this step be repeated periodically during the measurement period.
STEP 4: Retrieve Data Acquisition Equipment and Download Data
- Implement appropriate safety procedures.
- Refer to Appendix A.4 Onset HOBO 4-Channel Analog Logger (UX120-006M) with Onset HOBO Split-Core Current Sensor
- Confirm that the logger has collected the required operational data per the instructions in section A.4.5. Do not yet remove the logger from the equipment. Be careful not to stop the logger when downloading data.
- Once data acquisition has been confirmed, stop the logger per the instructions in section A.4.6.
- Remove the data logger and return to NYC Energy Tools.
Measure Long-Term Light On/Off Operation and Take Fixture Inventory
This approach should be used when other measurement strategies are not appropriate, or where it is desirable to characterize different occupancy patterns based on space types.
STEP 1: Preparation for Data Acquisition
- Confirm site conditions and locations where data acquisition equipment will be placed.
- Obtain measurement equipment from NYC Energy Tools:
- Light On/Off Data Logger (UX90-002)
- Refer to Appendix A.5: Onset HOBO Light On/Off Data Logger (UX90-002)
- Set up and deploy data logger per the instructions in sections A.5.1 to A.5.3.
STEP 2: Installation at the Site
- Implement appropriate safety procedures.
- Refer to Appendix A.5: Onset HOBO Light On/Off Data Logger (UX90-002)
- Install the light on/off loggers in the appropriate spaces and be sure the loggers pass calibration with the lights on as per the instructions in section A.5.4 and A.5.5.
- Initial field setup is now complete.
STEP 3: Verify Data is Being Collected
- Implement appropriate safety procedures.
- If possible, wait for the first recording period to pass during the installation at site; if not, return to the site as soon as possible to retrieve data from the system. Do not remove the logger from the equipment.
- Refer to Appendix A.5: Onset HOBO Light On/Off Data Logger (UC90-002)
- Confirm that the logger is collecting data and that system operation is being recorded per the instructions in section A.5.6. Be careful not to stop the logger when downloading data.
- It is recommended that this step be repeated periodically during the measurement period.
STEP 4: Retrieve Data Acquisition Equipment and Download Data
- Implement appropriate safety procedures.
- Refer to Appendix A.5: Onset HOBO Light On/Off Data Logger (UX90-002)
- Confirm that the logger has collected the required operational data per the instructions in section A.5.6. Do not yet remove the logger from the equipment. Be careful not to stop the logger when downloading the data.
- Once data acquisition has been confirmed, stop the logger per the instructions in section A.5.7.
- Remove the data logger and return to NYC Energy Tools.
Calculation Methodology
Total annual energy (in kWh) is calculated using the general equation, below:
E\left[\frac{kWh}{year}\right]=\sum_{i=1}^{N}T_i [Hours] * P_i[kW]where,
E = electricity use of the system in kW/year
Ti = total time that AHU is in each operational bin, in hours/year (note that operational bin can be defined by temperature ranges or scheduling characteristics)
Pi = average motor power draw for each operational bin, in kW
N = Number of operational bins
Four Microsoft Excel workbooks have been developed along with this guide to facilitate the calculation of total annual energy consumption from the measured data:
- Long-term true power measurements using a power logger – This workbook calculates annual consumption using average hourly power draw (in kW) as measured by a DENT power logger. This workbook is primarily designed for measurement of the main feed at the panel or groups of main feeds to lighting panels at the switchgear.
- AC current measurement at main feed with current sensors– This workbook calculates annual consumption using hourly average current (in amperes), as directly measured by current sensors, and spot measurements for true power. This workbook is primarily designed for measurement of the main feed at the panel or groups of main feeds to lighting panels at the switchgear.
- AC current measurement at one or more circuits with current sensors– This workbook calculates annual consumption using hourly average current (in amperes), as directly measured by current sensors, and spot measurements for true power. This workbook can be used with measurements of individual circuits or groups of circuits.
- Fixture inventory and long-term light on/off measurements – This workbook calculates annual consumption using a physical count of the fixture types and wattage in each space and lighting on/off loggers to generate an operational schedule. Where possible, a one-time measurement of true power on the lights in the spaces being measured is encouraged. This workbook is based on fixture types and grouped by space/occupancy.
Instructions are included in each workbook that detail how to input data and how to interpret and make use of the results. Specific calculation methodologies can be found in Appendix A.22: Lighting on Mixed Panelboards With Automatic Controls Calculations and are captured in the workbooks. All spreadsheets assume all days measured are representative of typical occupancy. Manual adjustments may need to be made if some days are atypical (e.g., a holiday on a weekday). Click on the workbook name to download.
Reporting Recommendations
As part of the documentation of expected avoided energy use, the integration of measurements and calculation methodology discussed in this guide will serve to enhance these projections. To facilitate transparency and data quality control, the following pieces of information should be documented to accompany expected savings calculations:
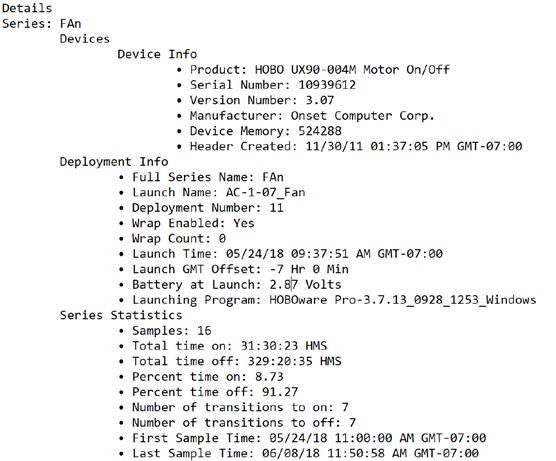
- Measurement tool information and dates of measurement. The HOBOware software records logger information (such as product, serial number, and version number) as well as deployment and measurement dates. To export this information, use the software to open the logger data file, then select “Export Details” from the File menu; this will produce a text file like the one shown in Figure 11. Repeat for all data loggers that were deployed and include all files with the funding application.
- If a BAS was used to collect any of the information discussed in this guide, submit a brief description of the system, including:
- BAS manufacturer and model
- BAS software and version number
- Measurement dates
- Most recent date of sensor calibration (if a sensor was used)
- The completed workbook(s) containing measured data.
It is expected that the user will be responsible for measuring the system of interest and compiling the data input to the calculation tools. The output of these tools can be directly used to satisfy reporting requirements.