Air-Cooled Chiller Measurement Guide
Published: June 24, 2020
By: Phillip Chao, PhD | Applied Research Scientist, Peter Phung, Tom Lui | Interns, Duncan Prahl, RA, AIA | Sr. Applied Research Scientist
Reviewed by: Jillian Panagakos | Jr. Engineer, Honey Berk, LEED AP O&M,CMVP | Managing Director
Helpful Resources
Download this Guide
DownloadGeneral System
This guide describes the measurement approach for quantifying avoided energy use associated with retrofitting an existing chiller with an air-cooled chiller.
Safety
This guide does not cover health and safety aspects of the collection of measurements at facilities. There are many hazards that exist in facilities surrounding the collection of measurements, including but not limited to: electrical safety, fall protection, personal protective equipment, control of hazardous energy (lock out/ tag out), confined space, respiratory protection, and machine safeguarding. Part of the measurement planning process must include the identification and mitigation of these and other hazards. The implementation of a measurement strategy and installation of measurement equipment should be performed by qualified personnel.
Description of System
The following sections provide background information on the components of air-cooled chillers. If you are already familiar with the system, you may skip to the Measurement Description for System section.
System Overview
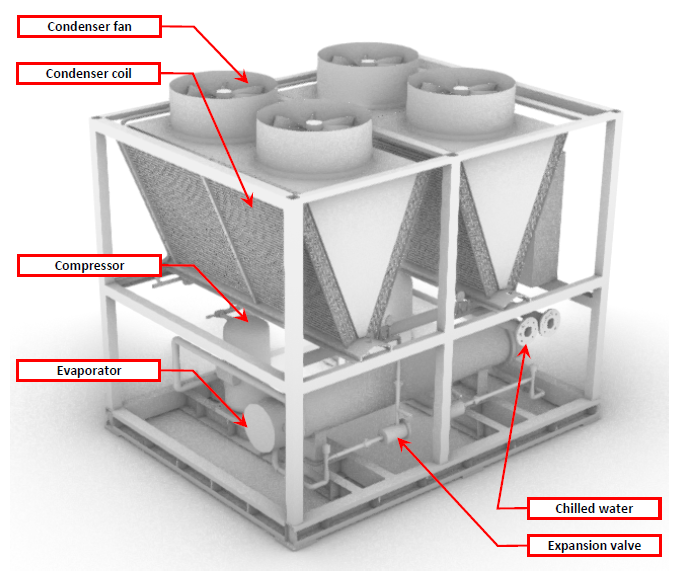
An air-cooled chiller provides chilled water to air handling units in a facility. The primary components of an air-cooled chiller are listed below and shown in Figure 1.
- The evaporator transfers heat from the chilled water to the refrigerant.
- The compressor increases the temperature and pressure of the refrigerant; a chiller may have one or more compressors.
- Refrigerant leaves the compressor and flows through the condenser coils to reject heat and lower the temperature of the refrigerant.
- Condenser fans cool down the refrigerant by forcing airflow over the condenser coils using outdoor air.
- The expansion valve reduces the pressure in the refrigerant, allowing it to collect heat in the evaporator.
Air-cooled chillers may be customized with a variety of high-performance components, such as variable frequency drives (VFD) on condenser fans and compressors, high efficiency compressor designs, thermostatic or electronic expansion valves, condenser coils with enhanced heat transfer characteristics, optimized condenser fan design and system airflow characteristics, and digital direct control systems that optimize the energy efficiency of the chiller.
Key Variables Associated with Calculating Energy Consumption of an Air-Cooled Chiller
To calculate annual electricity savings (kWh) associated with an air-cooled chiller, compressor power (kW), cooling load, and total system runtime need to be measured.
The necessary variables to assess the energy savings are:
- Evaporator (chilled) water flow rate
- Evaporator (chilled) water return temperature (from building)
- Evaporator (chilled) water supply temperature (to building)
- Chiller true RMS power consumption coincident with other measurements
- Operating schedule
- OAT
Operating Characteristics
Because an air-cooled chiller generally comes as a single package, its control algorithms are optimized to balance the electrical energy consumption between the condenser fans and the compressor pumps. Running fans at higher speed or running multiple fans simultaneously reduces compressor energy, and vice versa. Regardless of whether the fans are variable- or constant-speed (or if the compressor is variable- or constant-speed), the appropriate sensors, direct digital controls, and control algorithms should minimize energy consumption.
Systems may have either constant- or variable-speed condenser fans. For constant-speed fans, the air flow rate through the heat exchanger is modulated by staging the fans. For variable-speed, the fans all run at the same speed, which is modulated continuously.
There are three capacity-control approaches for constant-speed compressors. First, systems with multiple compressors may be staged to meet the load. The drawbacks of this approach are less precise control and wear and tear from turning the compressors on and off. Secondly, for screw compressors only, it is possible to unload the compressor. A slide valve controls which suction inlets are open along the length of the screw; with fewer inlets open, there is less refrigerant compression. The third approach, referred to as hot gas bypass, occurs when some of the refrigerant leaving the compressor is diverted away from the condenser and simply returns to the compressor at high temperature and pressure. This approach is less common today due to its inherent inefficiency since the compressor still operates at full capacity. Variable-speed compressors are both staged and modulated in speed to precisely meet demand.
Scope of This Guide
This guide describes how to measure and analyze the annual energy consumption of an air-cooled chiller system as a complete replacement for an existing cooling tower and chiller. As such, a primary goal is to describe the data that should be collected through measurements and the appropriate equipment to perform those measurements. Measurement of the pumping energy associated with the chilled water distribution in the facility is not discussed in this guide.
Since the retrofit is a wholesale change to the cooling system, the assessment of energy savings may require a separate approach to cover evaluation of the annual energy consumption of the pre-retrofit condition. Existing cooling systems may vary, from absorption, water-cooled, or air-cooled chillers. The cooling load is assumed to be the same for both pre- and post-retrofit conditions. Interactive effects with whole-facility cooling load due to operational or equipment changes to the distribution system are ignored. Nevertheless, it is important to note any operational changes and account for them as non-routine adjustments.
Measurements
Measurement Approach
The measurement boundary, as shown in Figure 2, includes the energy used to run the condenser, evaporator, compressors and their motors, condenser fans and their motors, and the energy used in the chilled water loop.
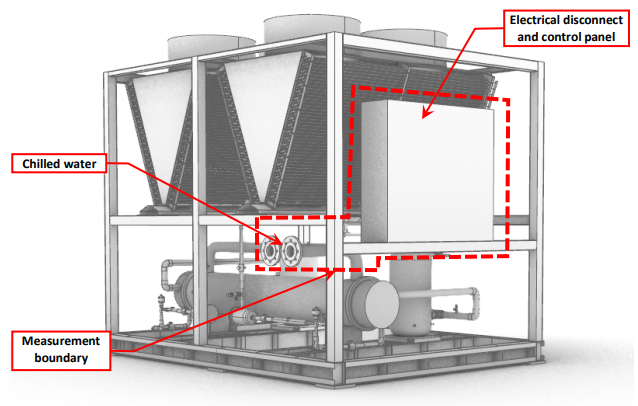
Despite the varied configurations of air-cooled chillers, one general measurement strategy is applicable. To accurately model annual energy consumption from a short-term measurement, the total electrical energy needs to be measured for the fan and compressor motors and ancillary electronics of the chiller, as does the total cooling output (Btus delivered to the building through the chilled water loop).
Given that the system is most likely installed as a single unit with an integrated BAS, this guide also provides limited guidance on how to use trended data from a building automation system (BAS).
Chiller performance is often defined by the coefficient of performance (COP), or the amount of refrigeration produced by one unit of electricity. The COP can be predicted using the Gordan-Ng chiller model[1], which allows the use of smaller datasets to predict the performance and energy usage of a chiller for a much wider range. As such, a few weeks of chiller performance data collected during different seasons can be extrapolated to reasonably predict annual electricity consumption.
Electricity – Measure at the Main Feed to the Chiller
A power meter is used to measure the power to the chiller at the switchgear or disconnect that supplies power to the entire system. It is important to measure the power over the full range of loading conditions to get an accurate representation of the chiller. Several weeks of measurement in different seasons, backed up by documentation showing the programming in the controller, is generally sufficient to capture the operation of the system with respect to OAT.
Cooling Load
The cooling load requires the measurement of the chilled water loop flow rate and the temperature difference (i.e., Delta T) between the supply and return in the chilled water loop. Pressure gauges mounted on the inlet and outlet of each of the chilled water pumps measure the pressure drop across the pumps. Flow rate is then determined from the manufacturer’s pump curve. The flow rate should be summed across all the pumps to obtain the full chilled water loop flow rate. The temperature difference in the chilled water loop should be measured with thermocouples at the supply and return of the chilled water loop (or inlet and outlet of the evaporator). The chiller or BAS may also have a flow meter and temperature sensors that can be used, or an onboard chilled water Btu meter.
Outdoor Air Temperature
Taking measurements for at least two weeks during the hottest time of summer and two weeks during spring or fall should be sufficient to capture the operation of the system and characterize the cooling load with respect to OAT. It is important to pick measurement periods where the full range of OAT can be covered, to develop a robust annual performance model.
Measurement Tools and Equipment
The measurements in this guide can be performed with the equipment listed in Table 1; more detailed descriptions have been provided in Table 2. NYC agency employees can borrow the recommended equipment from NYC Energy Tools, and have it delivered to their facility. Third-party M&V consultants and others can use this equipment list as guidance, recognizing that many manufacturers make comparable equipment. Inclusion on the list in Table 1 or Table 2 should not be construed as an endorsement of these manufacturers.
| Measurement | Units | Tool | NYC Energy Tools Equipment |
|---|---|---|---|
| True RMS Energy | kWh | Data-logging Power Meter and Current Transformers | DENT ELITEpro XC Portable Power Data Logger (EXCUNC) DENT 16” RoCoil Flexible Rope Current Transformers (CT-R16-A4-U) |
| Chilled Water Loop Return and Supply Temperatures | °F | Thermocouple and Data Logger | Onset HOBO Thermocouple Sensor (Type T 6ft Beaded) Onset HOBO 4-Channel Thermocouple Logger (UX120-014M) |
| Chilled Water Pumps Pressure at Primary Chilled Water Pumps | PSI | Gauge Pressure Sensor and Data Logger | Onset HOBO Gauge Pressure Sensor (T-ASH-G2-500) Onset HOBO 4-Channel Analog Logger (UX120-006M) |
| OAT | °F | Weatherproof Temperature/ Relative Humidity Data Logger | Onset HOBO Temperature/Relative Humidity Data Logger (MX2301) |
  | DENT ELITEpro XC Portable Power Data Logger (EXCUNC) DENT 16” RoCoil Flexible Rope Current Transformers (CT-R16-A4-U) Provides a measurement of true RMS power from voltage and current inputs and records long-term power (kW) and energy (kWh) measurements. Requires ELOG19 software and USB connection cable for programming and downloading data files. |
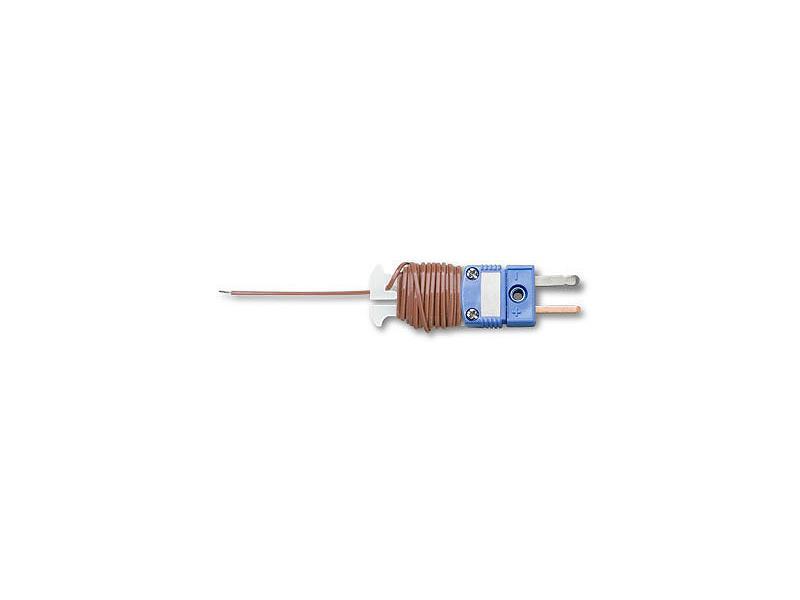  | Onset HOBO Thermocouple Sensor (Type T 6ft Beaded) Onset HOBO 4-Channel Thermocouple Logger (UX120-014M) The UX120-014M is a four-channel data logger for measuring and recording temperature in a broad range of monitoring applications. |
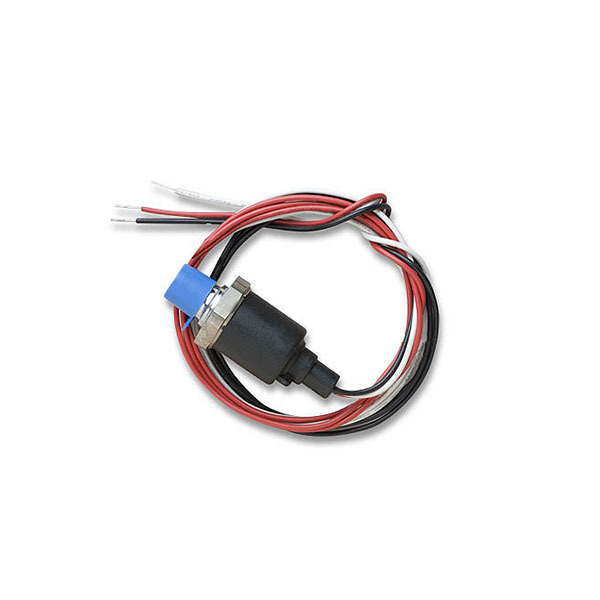 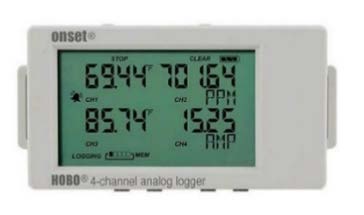 | Onset HOBO Gauge Pressure Sensor (T-ASH-G2-500) Onset HOBO 4-Channel Analog Logger (UX120-006M) The gauge pressure sensor provides precision pressure measurements in water or other compatible gases and fluids. |
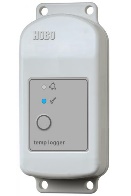 | Onset HOBO Temperature/Relative Humidity Data Logger (MX2301) Records outdoor air temperature and relative humidity using internal sensors. Requires HOBOware software and a USB connection cable for programming and downloading data files. |
Measurement Strategies
The following instructions have been developed for each measurement strategy discussed in this guide. While these are reasonably detailed, certain aspects of each strategy may need to be modified based on the specific system configuration at each facility. Early surveying of the facility is recommended when tailoring each strategy to unique site conditions. It is also important to remove outlier data, particularly when the system is in a transient state. See the discussion in the Calculation Methodology section.
To calculate COP, there are separate measurement strategies for electrical power and cooling load, and there is one alternative strategy to measure both metrics. If a BAS and sensors for the relevant variables are available, then BAS data may be used, provided the BAS can trend data and has sufficient data storage capacity and data export capability.
The measurement recommendations reference supplementary equipment guides, which can be found in Appendix A.
A.2: Fluke 345 Clamp Meter
A.3: DENT ELITEpro XC Power Meter
A.7: Onset HOBO Outdoor Temperature/RH Data Logger
A.9: Onset HOBO Gauge Pressure Sensor and Onset HOBO 4-Channel Analog Logger (UX120-006M)
A.12: Onset HOBO Thermocouple Sensor and Onset HOBO 4-Channel Thermocouple Logger (UX120-
014M)
Measure Power at the Main Feed to the Chiller Using a Data-logging Power Meter
This measurement is needed to calculate the COP of the system at various operating points, as an input to the chiller model and to develop an operating schedule. Measurement is taken at the main feed to the chiller, either at the switchgear or within the chiller itself.
STEP 1: Preparation for Data Acquisition
- Confirm site conditions and locations where data acquisition equipment will be placed.
- Obtain measurement equipment from NYC Energy Tools:
- DENT ELITEpro XC Energy Logger – (EXCUNC) with 16” Flexible CTs (Current Transformers) – (DENT CT-R16-A4-U)
- Refer to Appendix A.3: DENT ELITEpro XC Power Meter
- Set up and initialize the DENT logger per the instructions in section A.3.1.
STEP 2: Installation at the Site
- Implement appropriate safety procedures.
- Refer to Appendix A.3: DENT ELITEpro XC Power Meter
- Install the DENT ELITEpro XC Power Meter using section sA.3.2 to A.3.3 as guidance.
- Initial field setup is now complete
STEP 3: Verify Data is Being Collected
- Implement appropriate safety procedures.
- If possible, wait for the first recording period to pass during the installation at site; if not, return to the site as soon as possible to retrieve data from the logger to verify data collection. Do not remove the logger from the equipment.
- Refer to Appendix A.3: DENT ELITEpro XC Power Meter
- Confirm that the DENT ELITEpro XC power meter is collecting data and that system operation is being recorded per the instructions in section A.3.4. Be careful not to stop the meter when downloading data.
- It is recommended that this step be repeated periodically during the measurement period.
STEP 4: Retrieve Data Acquisition Equipment and Download Data
- Implement appropriate safety procedures.
- Refer to Appendix A.3: DENT ELITEpro XC Power Meter
- Confirm that the DENT ELITEpro XC has collected the required data per the instructions in section A.3.4. Do not yet remove the meter from the equipment. Be careful not to stop the meter when downloading data.
- Once data acquisition has been confirmed, stop the logger per the instructions in section A.3.5.
- Remove the data logger and return it to NYC Energy Tools.
Measure Cooling Load with Thermocouples and Pressure Gauges
This measurement is needed to calculate the COP and cooling output of the system at various operating points, and to collect temperatures needed for the chiller model. This measurement approach is suitable for constant- or variable-speed chilled water pumps. The pressure gauges are mounted at the suction and outlet of each pump. The thermocouples are mounted at the inlet and outlet of the chilled water loop to the evaporator.
STEP 1: Preparation for Data Acquisition
- Confirm site conditions and locations where data acquisition equipment will be placed.
- Obtain measurement equipment from NYC Energy Tools:
- Onset HOBO 4-Channel Analog Logger (UX120-006M) – one per pump
- Onset HOBO Gauge Pressure Sensor (T-ASH-G2-500) – two per pump
- Onset HOBO Thermocouple Sensor (Type T 6ft Beaded) – two sensors
- Onset HOBO 4-Channel Thermocouple Logger (UX120-014M) – one or two data loggers, depending on how close the inlet and outlet pipes of the evaporator are to each other.
- Refer to Appendices A.9 and A.12: Gauge Pressure Sensor and Thermocouple Sensor
- Set up and initialize the 4-channel analog logger per the instructions in sections A.9.1 and A.9.2.
- Set up and initialize the 4-channel thermocouple logger per the instructions in sections A.12.1 and A.12.2.
STEP 2: Installation at the Site
- Implement appropriate safety procedures.
- Refer to Appendices A.9 and A.12: Gauge Pressure Sensor and Thermocouple Sensor
- Install the gauge pressure sensor and data logger using sections A.9.3 and A.9.4 as guidance.
- Install the thermocouple sensor and data logger using sections A.12.3 and A.12.4 as guidance.
- Initial field setup is not complete.
STEP 3: Verify Data is Being Collected
- Implement appropriate safety procedures.
- If possible, wait for the first recording period to pass during the installation at site; if not, return to the site as soon as possible to retrieve data from the loggers to verify data collection. Do not remove the logger from the equipment.
- Refer to Appendices A.9 and A.12: Gauge Pressure Sensor and Thermocouple Sensor
- Confirm that the Onset HOBO 4-Channel Analog Logger and Onset HOBO Thermocouple Logger are collecting data and that system operation is being recorded per the instructions in sections A.9.5 and A.12.5, respectively. Be careful not to stop the meters when downloading data.
- It is recommended that this step be repeated periodically during the measurement period.
STEP 4: Retrieve Data Acquisition Equipment and Download Data
- Implement appropriate safety procedures.
- Refer to Appendices A.9 and A12: Gauge Pressure Sensor and 4-Channel Analog Logger
- Confirm that the Onset HOBO 4-Channel Analog Logger has collected the required data per the instructions in section A.9.5. Do not yet remove the meter from the equipment. Be careful not to stop the meter when downloading data.
- Once data acquisition has been confirmed, stop the logger per the instructions in section A.9.5.
- Refer to Appendices A.9 and A12: Gauge Pressure Sensor and 4-Channel Analog Logger
- Confirm that the Onset HOBO Thermocouple Logger has collected the required data per the instructions in section A.12.5. Do not yet remove the meter from the equipment. Be careful not to stop the meter when downloading data.
- Once data acquisition has been confirmed, stop the logger per the instructions in section A.12.5.
- Remove the data loggers and sensors and return them to NYC Energy Tools.
Measure Outside Air Temperature
This measurement is needed as an input to the chiller model.
STEP 1: Preparation for Data Acquisition
- Confirm site conditions and locations where data acquisition equipment will be placed.
- Obtain measurement equipment from NYC Energy Tools:
- Onset HOBO Temperature/RH Weatherproof Data Logger (MX2301)
- Refer to Appendix A.7 Onset HOBO Temperature/RH Weatherproof Data Logger
- Set up and deploy data logger per the instructions in sections A.7.1 to A.7.3.
STEP 2: Installation at the Site
- Implement appropriate safety procedures.
- Working with the appropriate facility personnel, access the AHU to position Temperature/RH Data Logger for OAT measurement.
- Refer to Appendix A.7 Onset HOBO Temperature/RH Weatherproof Data Logger
- Install the data logger using section A.7.4 as guidance.
STEP 3: Verify Data is Being Collected
- Implement appropriate safety procedures.
- If possible, wait for the first recording period to pass during the installation at site; if not, return to the site as soon as possible to retrieve data from the logger to verify data collection. Do not remove the logger from the equipment.
- Refer to Appendix A.7 Onset HOBO Temperature/RH Weatherproof Data Logger
- Confirm that the logger is collecting data and that system operation is being recorded per the instructions in section A.7.5. Be careful not to stop the logger when downloading data.
- It is recommended that this step be repeated periodically during the measurement period.
STEP 4: Retrieve Data Acquisition Equipment and Download Data
- Implement appropriate safety procedures.
- Refer to Appendix A.7 Onset HOBO Temperature/RH Weatherproof Data Logger
- Confirm that the logger has collected the required operational data per the instructions in section A.7.5 Do not yet remove the logger from the equipment. Be careful not to stop the logger when downloading data.
- Once data acquisition has been confirmed, stop the logger per the instructions in section A.7.5.
- Remove the data logger and return it to NYC Energy Tools.
Alternate Strategy for Power and Cooling Measurements – Download Data from a BAS
This measurement approach is intended to be used for a system that is controlled by a BAS with datatrending and exporting capability. Work with the building operator or commissioning agent to determine if hourly true RMS power, hourly Btu’s delivered to the building, OAT, and supply and return chilled water temperatures can be trended for the measurement periods. If the BAS calculates average hourly COP and evaporator load, those can also be used. If these data are available, they can be used to develop a chiller operation and power consumption model that can be extrapolated to a NOAA CNY. It is beyond the scope of this guide to detail the exact procedure to do this, given the variation in types and format of data export and duration of trending capabilities. The spreadsheet that accompanies this guide can be used as the basis of a calculation tool, if needed.
Calculation Methodology
Total annual energy (in kWh/year) is calculated using the general equation below:
E\left[\frac{kWh}{year}\right]=\sum_{i}T_i [Hours] * P_i[kW]where,
E = electricity use of chiller motor, kWh/year
i = bin index, or operational bin, as defined by the load frequency distribution
Ti = total amount of time the chiller is operational for a given operational bin, hours/year (note: The operational bin can be defined by temperature ranges or scheduling characteristics)
Pi = average motor power draw for each operational bin, i, in kW
A Microsoft Excel workbook has been developed along with this guide to facilitate the calculation of total annual energy consumption from the measured data:
- Air-cooled chiller: To be used when measuring annual consumption of the chiller using the average power draw (kW) as measured by a data-logging power meter, chilled water temperatures as measured by thermocouples, chilled water flow rate as measured by gauge pressure sensor, and the average hourly temperature as measured by a temperature/RH logger. Alternatively, the same data can be downloaded from a BAS, if available.
Instructions are included in the workbook that detail how to input data and how to interpret and make use of the results. Specific calculation methodology can be found in Appendix A.17: Air-Cooled Chiller Calculations and is captured in the workbook. Click on the workbook name to download.
It is important to note that the models developed with these measurements are for steady state operation. The data loggers will most likely capture transient operation of the chiller. To improve model fit, the data records for these periods must be manually removed prior to pasting into the spreadsheet. Transient operation occurs during startup and shutdown. The startup transient lasts approximately one hour, while the chiller and the building cooling load stabilize; the shutdown transient may be briefer, typically about 30 minutes.
Reporting Recommendations
As part of the documentation of expected avoided energy use, the integration of measurements and calculation methodology discussed in this guide will serve to enhance these projections. To facilitate transparency and data quality control, the following pieces of information should be documented to accompany expected savings calculations:
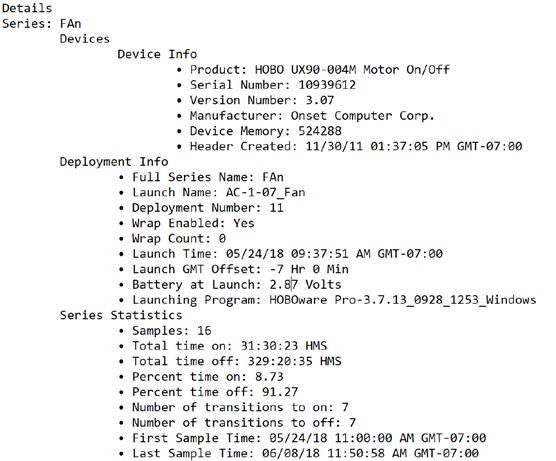
- Measurement tool information and dates of measurement. The HOBOware software records logger information (such as product, serial number, and version number) as well as deployment and measurement dates. To export this information, use the software to open the logger data file, then select “Export Details” from the File menu; this will produce a text file like the one shown in Figure 3. Repeat for all data loggers that were deployed and include all files with the funding application.
- If a BAS was used to collect any of the information discussed in this guide, submit a brief description of the system, including:
- BAS manufacturer and model
- BAS software and version number
- Measurement dates
- Most recent date of sensor calibration (if a sensor was used)
- The completed workbook(s) with measured data.
It is expected that the user will be responsible for measuring the system of interest and compiling the data input to the calculation tools. The output of these tools can be directly used to satisfy reporting requirements.