Industry-standard recommendations are to increase outside air flow and reduce (re-)circulation of air within buildings, in order to reduce SARS-CoV-2 concentration[1]. The Ventilation Increase Impacts (VII) Calculator was developed to help building operators assess the impact of these recommendations on their HVAC systems. It enables the user to calculate the heating load (in kBTU/hr) and cooling loads (in Tons) needed to satisfy discharge air setpoints when more outside air is used in a building. Loads are calculated over a range of outside air temperatures, outside air enthalpies and outside air fractions.
The calculator was derived from an existing Building Re-tuning energy savings calculator created by CUNY BPL to support NYC Department of Citywide Administrative Services Energy Management (DEM) Load Management efforts.
How it Works
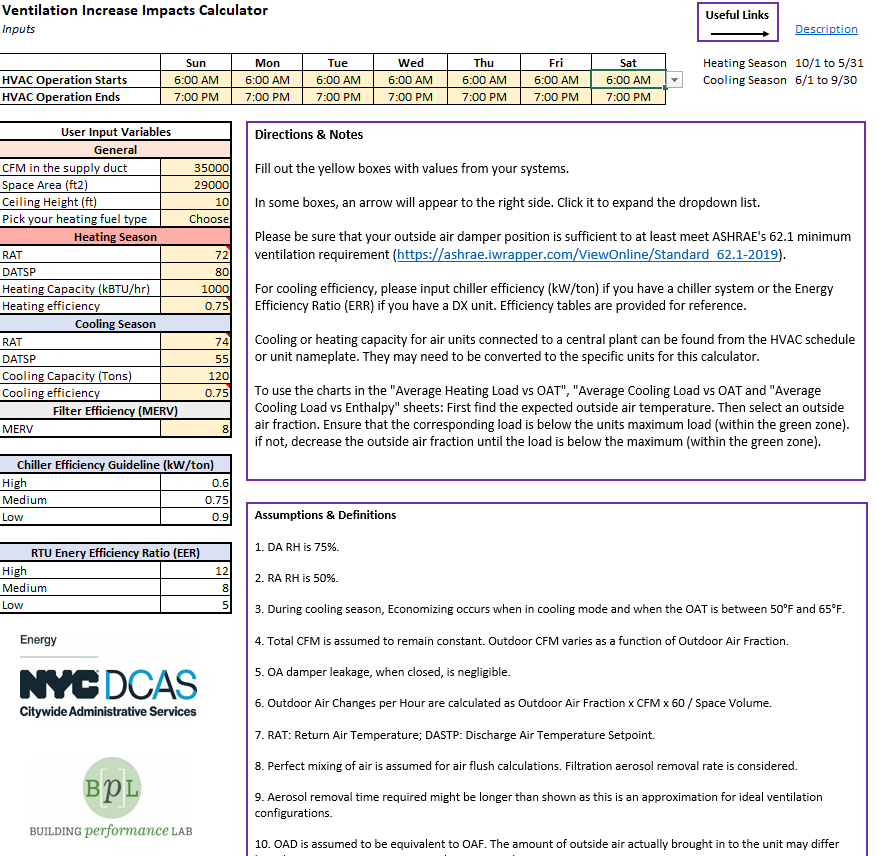
This calculator requires a series of inputs that can be found from equipment schedules, BAS data, sequences of operation, and operators’ discretion.
Input Tab
- For general use: Input the time of day when HVAC operation starts and ends. Also input CFM in the supply duct, space area, ceiling height, and fuel type used for heating.
- For the heating season: Input the unit’s expected return air temperature (RAT), discharge air temperature setpoint (DATSP) and heating efficiency.
- For the cooling season: Input the unit’s expected return air temperature (RAT), discharge air temperature setpoint (DATSP) and cooling efficiency.
- For air flush use: Input filter MERV rating.
Output Tabs
- “Ventilation Scenarios” tab: Shows achievable air exchange rates for different weather scenarios based on system’s capacity.
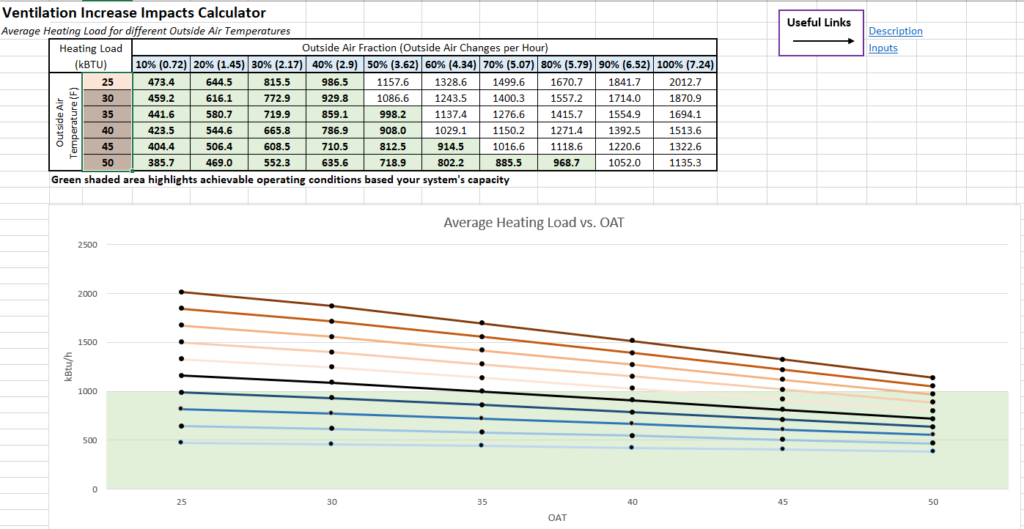
- “Average Heating Load vs OAT” tab: Shows the average load for heating outside air at specific temperatures and outside air fraction (air changes per hour).
- “Average Cooling Load vs OAT” tab: Shows the average load for cooling outside air at specific temperatures and outside air fraction (air changes per hour).
- “Average Cooling Load vs Enthalpy” tab: Shows the average cooling load for cooling outside air at specific enthalpies and outside air fraction (air changes per hour).
- “Energy Consumption” tab: Shows two graphs: Annualized cooling energy consumption, energy cost, and CO2 Equivalent GHG emissions for specific outside air fractions plus annualized heating energy consumption and CO2 equivalent GHG emissions for specific outside air fractions (air changes per hour).
- “Air Flush” tab: Shows aerosol removal time for different outside air fractions (outside air changes per hour) and removal efficiencies.
- “CO2 Risk Assesment” tab: Shows the amount required to reach the user defined CO2 critical threshold for different ventilation and weather scenarios.
Other Tabs
The last three tabs have values for calculations (Cooling Season calculations; Heating Season calculations; Dropdown Contents + Conversion); no user inputs required.
[1] ASHRAE, “Building Readiness” ASHRAE Website, https://www.ashrae.org/file%20library/technical%20resources/covid-19/ashrae-building-readiness.pdf