Pipe Surface Water Temperature
Understand how to measure Pipe Surface Water Temperature. Learn which tools and meter specifications you need to capture valid temperature readings. Follow a clear, step-by-step procedure to take multiple spot measurements and record your data for analysis and use in calculations.
Measurement Overview
What:Hourly measurements of water temperature (°F).
Why:Used to determine the cooling load and heat rejected by a cooling plant, the heat load delivered by a heating plant, and the heat recovered by an economizer.
Duration:Best practice is to collect the data for a minimum of six weeks at one-hour intervals.
When:Measurements should be taken when the system of interest is operating under normal conditions.
Type of Measurement:Proxy.
This technique uses a 4-channel analog logger with a thermocouple sensor to record long-term water temperature (°F) measurements at one-hour intervals. It measures fluid temperature from the surface of a pipe rather than directly in the water stream. The collected data can be used to determine the cooling load and heat rejected by a cooling plant, the heat load delivered by a heating plant, and the heat recovered by an economizer. For more details on how collected data is used for calculations, refer to the calculation methodology of the system being measured.
Measurements should be taken at one-hour intervals rather than as instantaneous values. When recording hourly measurements, the logger captures multiple temperature readings throughout the hour and stores the average value. Since temperature can fluctuate within an hour, an instantaneous reading may not accurately reflect these variations.
The duration of the long-term measurement should be a minimum of six weeks. Measurements should be taken when the system of interest is operating under normal conditions.
- Direct: Specifies a quantity of the exact item being measured.
- Proxy: Provides an indication of the system operation but does not directly measure the quantity in question.
Measurement Tools
The measurement tool needed for this procedure is a 4-channel analog logger that is compatible with thermocouple sensors. Thermocouple sensors are specially designed to measure very high temperatures, such as as those within the flue stack of a boiler, and very low temperatures, such as those on the surface of water pipes for a chiller system. Different thermocouple sensors are used to measure hot or cold pipes.
NYC agency personnel can borrow measurement data loggers, meters, or sensors from our tool library, by selecting tools based on the required measurement duration. See recommended tools found in our library:
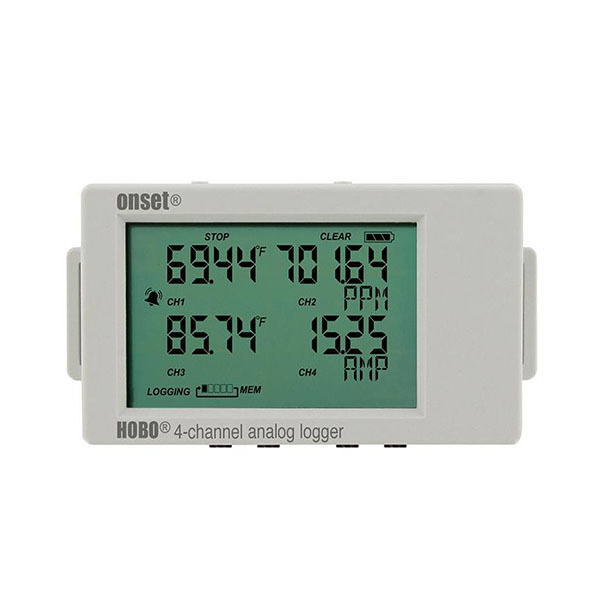
Standalone data logger that monitors up to four external sensors like thermocouple sensors.
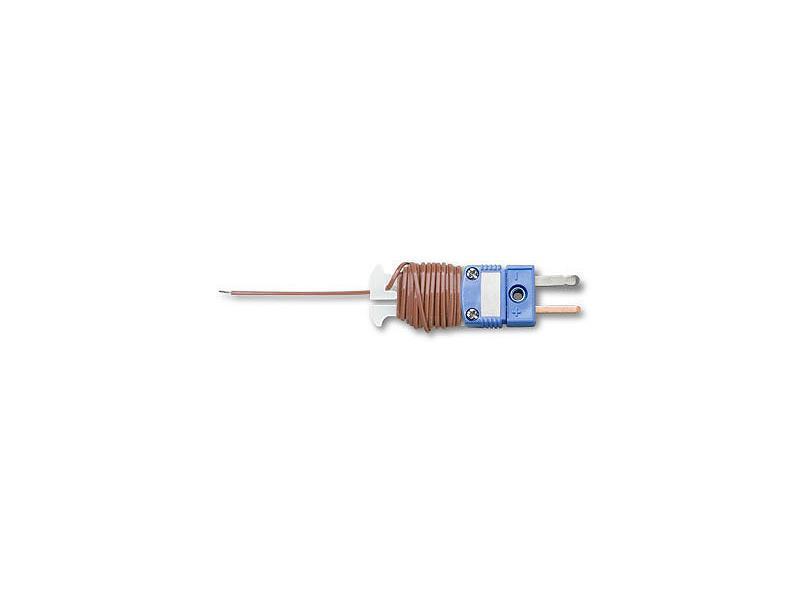
Beaded thermocouple probe, Teflon-insulated and responsive over a range of -200 to 100℃ (-328 to 212℉).
Measurement Steps
Prepare Tools
Use the manufacturer’s software to set up and launch the logger(s). Refer to the equipment’s user manual for detailed instructions on how to set up the logger.
- Logging interval: 1-hour4
- Date and time to start logging
- Date and time to stop logging
- Value(s) to measure: Temperature (oF)
- Activate input channels on the logger
- Type of thermocouple sensor (K-type or T-type)
- Sampling interval: 1-second
Install Tools
- Connect the sensors to the data logger.
- Place the data logger near the pipes. Avoid adhering the logger to the pipe itself.
- Clean the surface of the pipe where the sensor will be placed, removing any dust.
- Place the sensor on the clean surface and apply thermal tape to fully cover the sensor.


Verify Data Acquisition
Wait 24-48 hours to verify data collection. Return to the location of the measured equipment and use a laptop or a phone with the manufacturer’s proprietary software installed to do the following:
- If necessary, connect the logger to a laptop or phone via USB cable. Otherwise, use the software to connect with the data logger via Bluetooth.
- Analyze the data with a plot graph. This can be done with the proprietary software or Microsoft Excel after exporting the dataset as a .csv file.
- Determine whether measured results align with the expected operation of the system or component.
Retrieve Tools and Data
After verifying that the logger is collecting data, do the following:
- Allow the logger to collect data for the remainder of the measurement period.
- After the measurement period has concluded, remove the logger from the panel.
- If necessary, connect the logger to a laptop or phone via USB cable. Otherwise, use the software to connect with the data logger via Bluetooth.
- Use the proprietary software to stop the logger and end data collection.
- Download all data from the logger and save the file in the .csv file format for analysis.
Select Calculator(s)
These calculators will output estimated annual energy consumption or heat transfer for relevant components using measured data. Download the calculator for your specific component’s measurement strategy and add your measurement data.
Heat Exchangers
Liquid-to-Liquid Heat Transfer (Plate and Frame Heat Exchanger) CalculatorEstimates the annual heat transfer during the heating and cooling season of two fluids in a plate and frame heat exchanger.
Estimates the annual heat transfer during the heating and cooling season of two fluids in a plate and frame heat exchanger.
Troubleshooting
This section provides some troubleshooting tips for the most common issues with tool installation.