Water Pressure (Pump Curve)
Understand how to measure Water Pressure using the Pump Curve method. Learn which tools and specifications you need to capture valid water pressure readings and use them to infer water flow rate using pump curve and other data. Follow a clear, step-by-step procedure to take multiple spot measurements and record your data for analysis and use in calculations.
Measurement Overview
What:Hourly water pressure measurements.
Why:Used to infer the water flow rate (in GPM) for a pump.
Duration:For water loop systems that operate year-round and are driven by outside air temperature (OAT), one full year of measurement (365 consecutive days) is required for the baseline and one full year for the reporting period. For water loop systems that operate during a particular season, the full season must be measured for the baseline and reporting periods. For water loop systems that are not driven by OAT, it is recommended to measure flow rate for a minimum of six weeks.
When:Measurements should be taken when the system or component is operating under normal conditions.
Type of Measurement:Proxy.
This technique uses water pressure measurements to infer the water flow rate (in GPM) for a pump. This is called the pump curve method because it uses the pump curve, pressure data, and technical specifications of a pump to determine the water flow rate, as illustrated in Figure 1. A water loop system can have multiple pumps, and the water flow rate for each pump must first be determined and then summed to obtain the total flow rate of the water loop. Measurement data is used to calculate how much heat is added or removed by the heating or cooling plant. Data is also used to calculate energy/heat recovered with a liquid-to-liquid heat recovery system.
Water pressure measurements are taken at the inlet (suction) and outlet (discharge) sides of a pump. To measure water pressure, use a programmable data logger with pressure transducers installed on the access ports of the piping network. This is preferred over a pressure gauge reading because the pressure gauge introduces greater measurement error.
To properly use this technique, you need the pump impeller size, model number, and pump curve, as well as the information on the pump motor nameplate, such as the horsepower and efficiency (for each pump in the water loop)–in addition to the pressure measurements. Without this information, this technique cannot be executed. Depending on how the piping network is designed in the facility, a combination of a direct measurement of water flow rate and this measurement technique can be used.
Measurements should be taken at one-hour intervals; do not use instantaneous values. For water loop systems that operate year-round and are driven by outside air temperature (OAT), one full year of measurement (12 consecutive months, 52 consecutive weeks, or 365 consecutive days) is required for the baseline and one full year for the reporting period. For water loop systems that operate during a particular season, the full season must be measured for the baseline and reporting periods. For water loop systems that are not driven by OAT, it is recommended to measure flow rate for a minimum of six weeks. Measurements should be taken when the system or component is operating under normal conditions.
Figure 1 illustrates a typical pump curve with the flow rate (in GPM) marked on the horizontal axis and total head (in meters) marked on the vertical axis. Flow rate was determined by applying the pump impeller size and the total feet of head to the pump curve.

Total head is calculated by taking the difference between discharge and suction pressure and multiplying it by a constant. Design FT, design GPM, pump RPM, and pump horsepower are all obtained from the nameplate on the pump or from the technical specifications for that pump model.
\begin{equation*} \Delta P = Discharge \hspace{2mm} Pressure - Suction \hspace{2mm} Pressure\end{equation*}
\begin{equation*} Total \hspace{2mm} Head = \Delta P * 2.31 Pressure\end{equation*}
Where,
$\Delta P =$ differential pressure across the pump, psi
$Discharge \hspace{2mm} Pressure =$ water pressure leaving the pump, psi
$Suction \hspace{2mm} Pressure =$ water pressure entering the pump, psi
$Total \hspace{2mm} Head =$ operating pressure of the pump converted from psi, feet
$2.31 =$ constant equivalent to one pound of pressure per in $^2$ of water (at 60 degrees F), feet/psi
- Direct: Specifies a quantity of the exact item being measured.
- Proxy: Provides an indication of the system operation but does not directly measure the quantity in question.
Measurement Tools
The measurement tool needed for this procedure is a data logger with pressure transducers.
NYC agency personnel can borrow measurement data loggers, meters, or sensors from our tool library, by selecting tools based on the required measurement duration. See recommended tools found in our library:
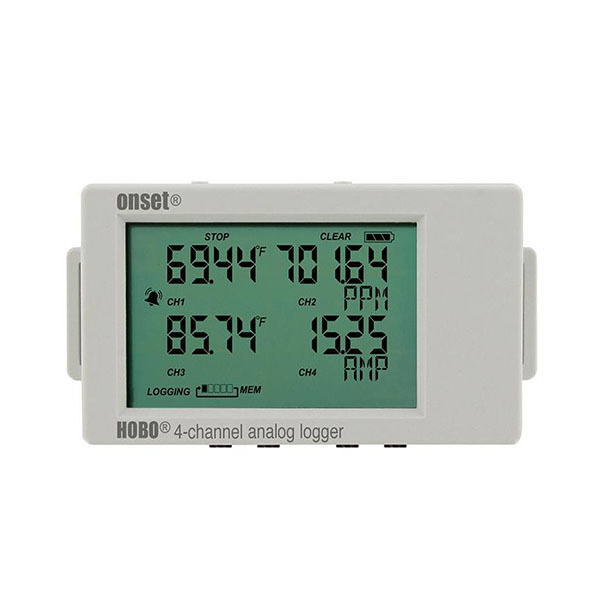
An analog logger that supports up to four external sensors allowing you to measure temperature, current, voltage, air flow, pressure and more in one single logger.
Standalone data logger that monitors a motor’s on and off conditions using an internal AC magnetic field sensor.
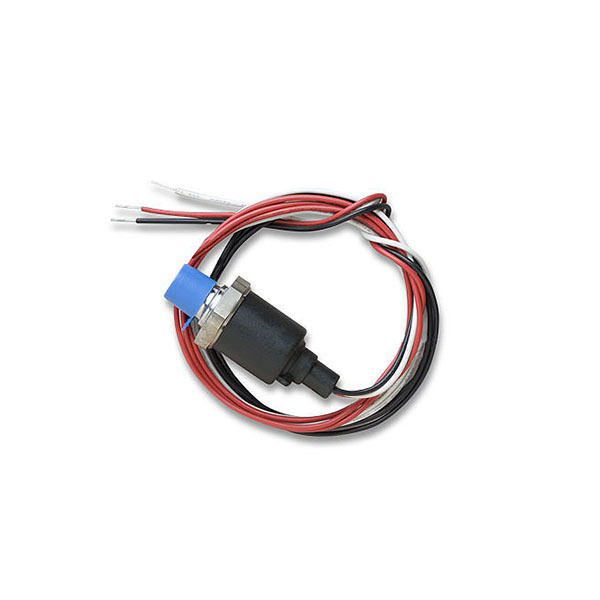
The Ashcroft Pressure Transducer measures voltage between 0V and 5V. The pressure transducer connects to the UX120-006M data logger which then converts the voltage signal to pressure in PSI units. Please refer to our video instructions for details on how to configure the UX120-006M to detect voltage and convert to pressure.
We recommend using this equipment, rather than the on-site pressure gauge, to determine the pump flow to reduce measurement error. One pressure transducer should be used for each side of the pump. Heating and cooling plants can have different pump configurations, such as primary-only and primary-secondary pumps. Additionally, pumps can operate at constant speed or variable speed.
Measurement Steps
Prepare Tools
Identify the temperature (hot or cold) of the pipes that will be measured. Use the manufacturer’s software to set up the logger. Refer to the user manual for detailed instructions on how to set up the logger.
- Logging interval: 1-hour
- Date and time to start logging
- Date and time to stop logging
- Values to measure: voltage (V) or pressure (psi)[1]
- Activate input channels on the logger
- Type of sensor
- Sampling interval: 1-second
Install Tools
- Confirm that the equipment is operational.
- Locate the pressure gauges that are installed on the suction and discharge sides of the pump.
- Connect the transducers to the data logger.
- Place the data logger near the pipes, avoiding placing the logger on the pipe itself.
- Confirm that the pressure gauge has a stop-valve to prevent water from flowing.
- If there is no stop valve on the piping system, consider using another technique to quantify the water flow.
- Remove the stop-valve and replace it with a T-shaped valve to stop the flow of water.
- Connect the transducer to the T-shaped valve.
- To avoid leaks, wrap Teflon tape around the installed equipment.
Verify Data Acquisition
Wait 24-48 hours to verify data collection. Return to the location of the measured equipment and use a laptop or a phone with the manufacturer’s proprietary software installed to do the following:
- If necessary, connect the logger to a laptop or phone via USB cable. Otherwise, use the software to connect with the data logger via Bluetooth.
- Analyze the data with a plot graph. This can be done with the proprietary software or Microsoft Excel after exporting the dataset as a .csv file.
- Determine whether the results align with the expected operation of the system or component based on observed operational patterns or known equipment schedules.
Retrieve Tools and Data
After verifying that the logger is collecting data, do the following:
- Allow the logger to collect data for the remainder of the measurement period.
- After the measurement period has concluded, remove the logger from the panel.
- If necessary, connect the logger to a laptop or phone via USB cable.
- Use the proprietary software to stop the logger and end data collection.
- Download all data from the logger and save the file in the .csv file format for analysis.
Select Calculator(s)
These calculators will output estimated annual energy consumption or heat transfer for relevant components using measured data. Download the calculator for your specific component’s measurement strategy and add your measurement data.
Heat Exchangers
Liquid-to-Liquid Heat Transfer (Plate and Frame Heat Exchanger) CalculatorEstimates the annual heat transfer during the heating and cooling season of two fluids in a plate and frame heat exchanger.
Estimates the annual heat transfer during the heating and cooling season of two fluids in a plate and frame heat exchanger.
Troubleshooting
This section provides some troubleshooting tips for the most common issues with tool installation.
Footnotes
[1] This is dependent on the measurement capability of the chosen logger.