Relative Humidity
Understand how to measure Relative Humidity. Learn which tools and meter specifications you need to capture valid relative humidity readings. Follow a clear, step-by-step procedure to take multiple spot measurements and record your data for analysis and use in calculations.
Measurement Overview
What:Hourly measurements of relative humidity.
Why:Used for calculations such as regression models to estimate the heat and energy recovered by an air-to-air heat/energy recovery system.
Duration:Measurements should be taken at one-hour average intervals; do not use instantaneous values. When taking one-hour measurements, the logger detects humidity several times every hour and stores the average value. Sometimes humidity can fluctuate over a one-hour period, and the instantaneous value will not indicate that change.
When:Measurements should be when the system of interest is operating under normal conditions.
Type of Measurement:Direct.
This technique uses data loggers to take long-term measurements of relative humidity (% RH) at one-hour intervals. This technique can be used to characterize the performance of heat/energy recovery ventilators. Data is used for calculations such as regression models to estimate the heat and energy recovered by an air-to-air heat/energy recovery system. For a more detailed description of how relative humidity data is used in calculations, please refer to the Air-to-Air Heat Transfer calculation methodology.
Relative humidity measurements should be taken at one-hour intervals and paired with the temperature of the system if both variables are required to characterize performance. Measurements should be taken at one-hour average intervals; do not use instantaneous values. When taking one-hour measurements, the logger detects humidity several times every hour and stores the average value. Sometimes humidity can fluctuate over a one-hour period, and the instantaneous value will not indicate that change.
The duration of the long-term measurement should be a minimum of six weeks. Measurements should be when the system of interest is operating under normal conditions.
- Direct: Specifies a quantity of the exact item being measured.
- Proxy: Provides an indication of the system operation but does not directly measure the quantity in question.
Measurement Tools
The measurement tool required for this procedure is a humidity data logger.
The data loggers should be installed in the ductwork with the air stream. The relative humidity data measured by the logger should be collected as hourly average values; not as instantaneous values. When operating under this method, the logger detects humidity fluctuations across the hour and stores the average value of those fluctuations, rather than the measured relative humidity value at an instantaneous point in time (which does not account for those changes).
NYC agency personnel can borrow measurement data loggers, meters, or sensors from our tool library, by selecting tools based on the required measurement duration. See recommended tools found in our library:
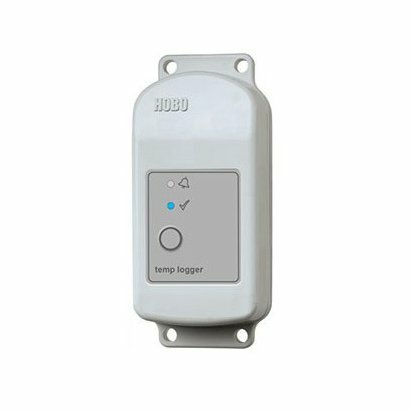
Weatherproof data logger that measures and records temperature and relative humidity in outdoor environments.
Measurement Steps
Prepare Tools
Use the manufacturer’s software to set up and launch the logger(s). Refer to the equipment’s user manual for detailed instructions on how to set up the logger.
- Logging interval: 1-hour
- Date and time to start logging
- Date and time to stop logging
- Values to measure: Relative Humidity (%), Temperature (F) if necessary
- Sampling interval: 1-second
Install Tools
To accurately measure relative humidity of outside air, use a weatherproof data logger only.
- Place the logger inside of the air duct as close as possible to the outside air damper. Alternatively, install the logger on the roof or somewhere with little foot traffic but away from direct sunlight.
- To measure relative humidity of the air streams inside of an AHU, place the loggers inside of the ductwork. AHUs typically have panels that open to reach inside of ductwork. There are up to four air streams inside an AHU: outside air, return air, mixed air, and supply/discharge air. A separate data logger should be used for each air stream.
- Confirm that the logger is recording, and that the sensor is accurately identifying the airstream’s temperature. If the logger has a screen, check that the temperature value is displayed on the logger screen. If the logger does not have a screen, use the software to connect to the logger and check the temperature it detects.
Verify Data Acquisition
Wait 24-48 hours to verify data collection. Return to the location of the measured equipment and use a laptop or a phone with the manufacturer’s proprietary software installed to do the following:
- If necessary, connect the logger to a laptop or phone via USB cable. Otherwise, use the software to connect with the data logger via Bluetooth.
- Analyze the data with a plot graph. This can be done with the proprietary software or Microsoft Excel after exporting the dataset as a .csv file.
- Determine whether the measured results align with the expected RH values based on observed weather trends.
Retrieve Tools and Data
After verifying that the logger is collecting data, do the following:
- Allow the logger to collect data for the remainder of the measurement period.
- After the measurement period has concluded, remove the logger from the panel.
- If necessary, connect the logger to a laptop or phone via USB cable. Otherwise, use the software to connect with the data logger via Bluetooth.
- Use the proprietary software to stop the logger and end data collection.
- Download all data from the logger and save the file in the .csv file format for analysis.
Select Calculator(s)
These calculators will output estimated annual energy consumption or heat transfer for relevant components using measured data. Download the calculator for your specific component’s measurement strategy and add your measurement data.
Fans and Motors
For AHU, Condenser, Burner and Cooling Tower Fans and Motors.
Variable Speed Fan Energy (kW) CalculatorEstimates annual electricity usage of two variable-speed fan motors using power data.
Estimates annual electricity usage of two variable-speed fan motors using power data.
Constant Speed CT Fan Energy (Runtime) CalculatorEstimates annual electricity consumption for up to four (4) constant speed cooling towers, using motor runtime data.
Estimates annual electricity consumption for up to four (4) constant speed cooling towers, using motor runtime data.
Variable Speed CT Fan Energy (kW) CalculatorEstimates annual electricity consumption for multiple variable speed cooling tower fans, using power data.
Estimates annual electricity consumption for multiple variable speed cooling tower fans, using power data.
Troubleshooting
This section provides some troubleshooting tips for the most common issues with tool installation.