Building Re-tuning (BRT)
Building Re–tuning (BRT), originally developed by the Pacific Northwest National Lab (PNNL), is a protocol for energy optimization and monitoring to improve building performance. The Department of Citywide Administrative Services (DCAS) Division of Energy Management (DEM) launched the Building Re-Tuning (formerly the Load Management) Program in 2016 to work with City buildings to find no/low cost operational energy saving solutions to help meet our 80 by 50 goals. DEM and CUNY BPL provide real-time data visualization tools, data analysis, and hands-on training to building operators in order to implement Building Re-Tuning and Load Management strategies.
The concept behind BRT is that just as a car owner would periodically “tune up” an automobile, facility managers can likewise “tune up” buildings for optimal and consistent performance. Using trend–log data collected from building systems, BRT allows users to identify operational problems that are causing energy waste by graphing actual operational data and comparing it against expected or previous conditions. This makes it possible to get a clearer sense of how the facility is performing “behind the scenes” — almost like looking at an x–ray of the building.
BRT emphasizes low–cost and no–cost operational improvements – most of these are implemented through the building control system at no cost other than the labor required to perform the re–tuning process and may also include minor repairs such as replacing faulty sensors. Small improvements such as these can lead in some cases to energy savings of up to 20%.
How To Implement BRT
BRT can be implemented in buildings with and without a Building Automation System (BAS). For buildings with a BAS, it's extensive trending capability is used to gather operational data from systems of interest. For buildings without a BAS, standalone data loggers, and sensors are installed on the systems of interest and used to gather operation data. See below for more on both approaches:
For Buildings with a BAS
Use our BRT Playbook to learn how to use your BAS to set up trend charts that provide a visual representation of your system’s operation over a period of time. The playbook will explain how you can use trend charts to assess your building’s operations, as well as for verifying sensor data.
For Buildings without a BAS
Use our noBAS measurement strategies for assessing and improving performance in four major system categories using data loggers based on Pacific Northwest National Lab’s Building Re-tuning Guides.
How To Quantify BRT Impact
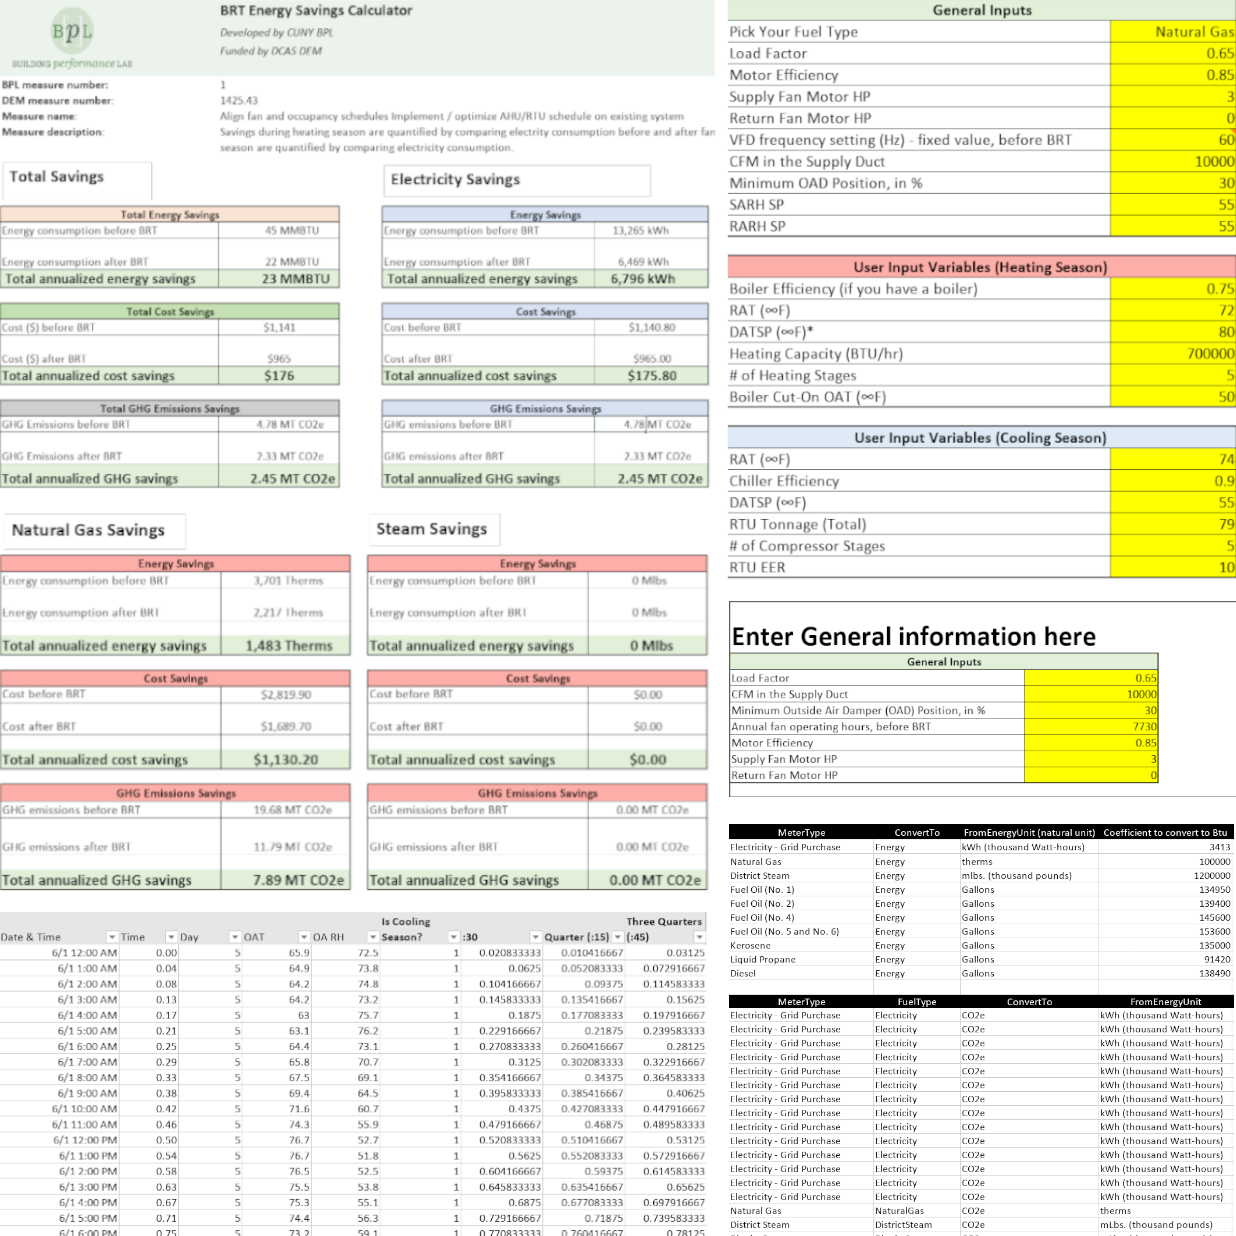
Implementing BRT measures can lead to energy savings at little to no cost when making operational changes. To help quantify these savings, we have developed calculators for a number of measures.
BRT Energy Savings Calculators
To calculate the impact of BRT measures, you can use the Energy Savings Calculators for each measure. The calculators are Microsoft Excel spreadsheets developed jointly by CUNY BPL and DCAS DEM to help you quantify energy savings.